|
Download Data (XLS File) |
|
||||||||
|
||||||||
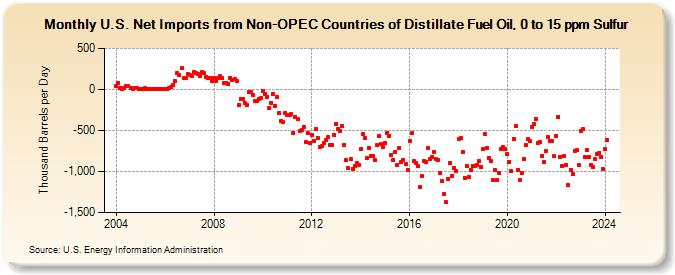
| U.S. Net Imports from Non-OPEC Countries of Distillate Fuel Oil, 0 to 15 ppm Sulfur (Thousand Barrels per Day) | ||||||||
| Year | Jan | Feb | Mar | Apr | May | Jun | Jul | Aug | Sep | Oct | Nov | Dec |
|---|---|---|---|---|---|---|---|---|---|---|---|---|
| 2004 | 43 | 79 | 19 | 2 | 13 | 43 | 36 | 21 | 8 | 18 | 20 | 1 |
| 2005 | 2 | 1 | 13 | 8 | 1 | 1 | 1 | 1 | 10 | 2 | 8 | 3 |
| 2006 | 11 | 0 | 17 | 35 | 57 | 97 | 206 | 174 | 263 | 137 | 139 | 185 |
| 2007 | 171 | 169 | 214 | 202 | 191 | 158 | 208 | 206 | 155 | 139 | 139 | 100 |
| 2008 | 143 | 105 | 140 | 160 | 139 | 84 | 81 | 72 | 138 | 110 | 125 | 100 |
| 2009 | -195 | -116 | -114 | -160 | -188 | -31 | -37 | -62 | -144 | -136 | -120 | -110 |
| 2010 | -24 | -57 | -91 | -223 | -162 | -51 | -199 | -91 | -290 | -387 | -401 | -286 |
| 2011 | -317 | -315 | -297 | -527 | -331 | -357 | -511 | -497 | -458 | -643 | -536 | -657 |
| 2012 | -552 | -630 | -484 | -591 | -700 | -690 | -649 | -617 | -576 | -671 | -682 | -555 |
| 2013 | -419 | -484 | -509 | -451 | -674 | -860 | -960 | -851 | -969 | -932 | -900 | -923 |
| 2014 | -723 | -538 | -589 | -840 | -714 | -814 | -811 | -862 | -677 | -571 | -666 | -705 |
| 2015 | -652 | -525 | -564 | -794 | -854 | -763 | -918 | -708 | -882 | -860 | -906 | -985 |
| 2016 | -628 | -534 | -875 | -896 | -936 | -1,190 | -1,059 | -866 | -888 | -713 | -843 | -828 |
| 2017 | -759 | -853 | -855 | -1,019 | -1,114 | -1,271 | -1,373 | -1,090 | -891 | -1,058 | -959 | -998 |
| 2018 | -608 | -593 | -760 | -1,076 | -932 | -1,061 | -977 | -928 | -931 | -917 | -877 | -943 |
| 2019 | -731 | -545 | -713 | -838 | -870 | -1,102 | -982 | -1,105 | -1,017 | -722 | -702 | -727 |
| 2020 | -787 | -879 | -989 | -600 | -444 | -978 | -1,108 | -1,014 | -847 | -674 | -604 | -633 |
| 2021 | -456 | -418 | -359 | -658 | -639 | -813 | -889 | -749 | -583 | -623 | -627 | -816 |
| 2022 | -567 | -336 | -825 | -938 | -813 | -921 | -1,170 | -986 | -1,032 | -746 | -742 | -926 |
| 2023 | -510 | -483 | -821 | -733 | -826 | -923 | -950 | -842 | -783 | -771 | -825 | -968 |
| 2024 | -726 | |||||||||||
| - = No Data Reported; -- = Not Applicable; NA = Not Available; W = Withheld to avoid disclosure of individual company data. |
| Release Date: 3/29/2024 |
| Next Release Date: 4/30/2024 |