|
Download Data (XLS File) |
|
||||||||
|
||||||||
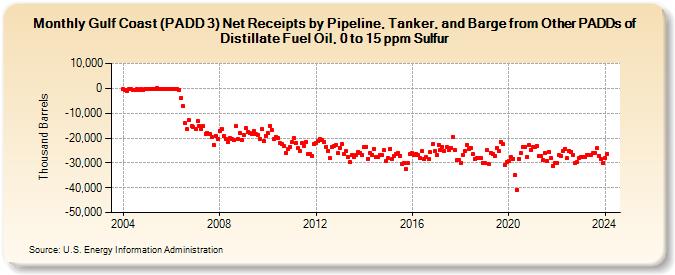
| Gulf Coast (PADD 3) Net Receipts by Pipeline, Tanker, and Barge from Other PADDs of Distillate Fuel Oil, 0 to 15 ppm Sulfur (Thousand Barrels) | ||||||||
| Year | Jan | Feb | Mar | Apr | May | Jun | Jul | Aug | Sep | Oct | Nov | Dec |
|---|---|---|---|---|---|---|---|---|---|---|---|---|
| 2004 | -273 | -473 | -990 | -407 | -407 | -723 | -506 | -336 | -701 | -455 | -524 | -458 |
| 2005 | -150 | -96 | -120 | -96 | -213 | 35 | -120 | -168 | -156 | -120 | -139 | -388 |
| 2006 | -402 | -447 | -399 | -192 | -635 | -3,748 | -7,256 | -14,081 | -16,542 | -12,892 | -15,310 | -15,695 |
| 2007 | -16,544 | -13,226 | -15,064 | -16,520 | -15,322 | -18,280 | -17,915 | -18,276 | -19,558 | -22,650 | -19,023 | -20,281 |
| 2008 | -17,265 | -16,383 | -19,201 | -20,441 | -21,586 | -19,908 | -20,262 | -20,786 | -15,265 | -20,273 | -17,984 | -20,654 |
| 2009 | -18,796 | -16,121 | -17,455 | -18,107 | -18,452 | -17,241 | -18,319 | -18,868 | -20,312 | -16,461 | -21,326 | -19,035 |
| 2010 | -18,156 | -15,039 | -16,655 | -20,346 | -19,544 | -20,092 | -22,113 | -22,243 | -23,388 | -25,966 | -24,438 | -23,560 |
| 2011 | -21,629 | -19,940 | -22,203 | -24,055 | -25,355 | -22,197 | -23,074 | -21,456 | -26,282 | -26,398 | -27,305 | -22,574 |
| 2012 | -21,950 | -21,026 | -20,490 | -20,902 | -21,653 | -23,497 | -25,323 | -28,068 | -23,414 | -23,203 | -22,807 | -26,159 |
| 2013 | -24,032 | -22,485 | -26,610 | -25,348 | -27,474 | -29,719 | -26,706 | -27,444 | -26,743 | -25,505 | -25,949 | -26,670 |
| 2014 | -23,803 | -23,477 | -28,325 | -25,877 | -26,781 | -24,413 | -27,502 | -27,696 | -26,702 | -27,011 | -24,946 | -29,188 |
| 2015 | -27,980 | -24,265 | -28,250 | -27,081 | -26,391 | -25,978 | -27,149 | -30,321 | -29,913 | -32,661 | -30,080 | -26,534 |
| 2016 | -26,040 | -27,012 | -26,380 | -26,741 | -28,068 | -25,412 | -28,550 | -27,802 | -28,554 | -25,682 | -22,440 | -25,365 |
| 2017 | -26,874 | -22,687 | -24,822 | -23,503 | -25,331 | -23,754 | -24,692 | -23,939 | -19,541 | -24,799 | -28,962 | -28,729 |
| 2018 | -30,188 | -26,725 | -25,194 | -22,763 | -24,239 | -24,076 | -26,462 | -28,545 | -28,205 | -28,085 | -28,110 | -30,039 |
| 2019 | -30,164 | -24,837 | -30,619 | -25,905 | -26,416 | -27,302 | -24,013 | -25,262 | -21,436 | -22,555 | -30,729 | -29,606 |
| 2020 | -29,252 | -27,819 | -28,362 | -35,054 | -40,958 | -28,378 | -26,084 | -23,478 | -23,566 | -27,532 | -23,004 | -24,718 |
| 2021 | -23,616 | -23,414 | -23,184 | -27,103 | -27,402 | -29,039 | -26,176 | -29,331 | -25,486 | -27,897 | -31,108 | -29,862 |
| 2022 | -30,104 | -26,962 | -27,136 | -25,063 | -24,321 | -28,193 | -25,189 | -25,480 | -26,701 | -30,083 | -29,465 | -28,127 |
| 2023 | -27,529 | -27,715 | -27,517 | -26,705 | -26,801 | -26,675 | -26,223 | -25,979 | -23,976 | -27,052 | -28,454 | -30,001 |
| 2024 | -28,052 | -26,349 | ||||||||||
| - = No Data Reported; -- = Not Applicable; NA = Not Available; W = Withheld to avoid disclosure of individual company data. |
| Release Date: 4/30/2024 |
| Next Release Date: 5/31/2024 |
Referring Pages: