|
Download Data (XLS File) |
|
||||||||
|
||||||||
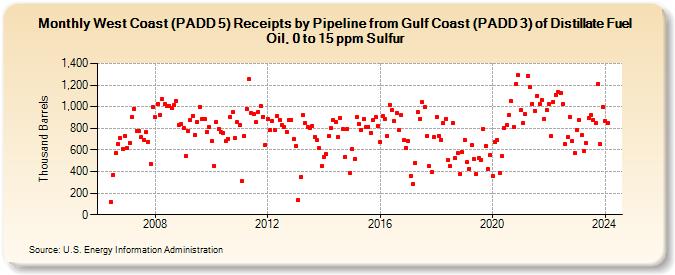
| West Coast (PADD 5) Receipts by Pipeline from Gulf Coast (PADD 3) of Distillate Fuel Oil, 0 to 15 ppm Sulfur (Thousand Barrels) | ||||||||
| Year | Jan | Feb | Mar | Apr | May | Jun | Jul | Aug | Sep | Oct | Nov | Dec |
|---|---|---|---|---|---|---|---|---|---|---|---|---|
| 2006 | 118 | 364 | 571 | 653 | 708 | 604 | 730 | |||||
| 2007 | 622 | 664 | 901 | 983 | 778 | 775 | 716 | 695 | 765 | 677 | 471 | 995 |
| 2008 | 902 | 1,029 | 923 | 1,070 | 1,023 | 1,011 | 1,008 | 984 | 1,014 | 1,053 | 826 | 837 |
| 2009 | 800 | 542 | 779 | 878 | 917 | 740 | 861 | 999 | 889 | 884 | 767 | 812 |
| 2010 | 682 | 455 | 856 | 795 | 766 | 759 | 678 | 705 | 907 | 948 | 711 | 854 |
| 2011 | 833 | 308 | 727 | 980 | 1,252 | 942 | 930 | 858 | 952 | 1,007 | 908 | 649 |
| 2012 | 888 | 782 | 864 | 784 | 915 | 881 | 835 | 815 | 768 | 874 | 880 | 700 |
| 2013 | 639 | 138 | 349 | 919 | 850 | 808 | 805 | 824 | 718 | 690 | 614 | 453 |
| 2014 | 531 | 562 | 730 | 801 | 875 | 859 | 716 | 896 | 791 | 538 | 794 | 382 |
| 2015 | 607 | 516 | 904 | 842 | 788 | 887 | 808 | 815 | 759 | 881 | 904 | 820 |
| 2016 | 671 | 911 | 882 | 728 | 1,018 | 966 | 863 | 946 | 785 | 921 | 688 | 618 |
| 2017 | 682 | 357 | 280 | 479 | 952 | 889 | 1,041 | 993 | 725 | 447 | 393 | 715 |
| 2018 | 906 | 730 | 695 | 846 | 889 | 505 | 449 | 850 | 524 | 568 | 377 | 578 |
| 2019 | 694 | 485 | 427 | 641 | 514 | 376 | 522 | 511 | 794 | 638 | 420 | 551 |
| 2020 | 357 | 671 | 693 | 384 | 539 | 799 | 833 | 925 | 1,049 | 813 | 1,214 | 1,293 |
| 2021 | 967 | 850 | 928 | 1,287 | 1,179 | 1,025 | 962 | 1,103 | 1,026 | 1,061 | 885 | 971 |
| 2022 | 1,029 | 728 | 1,046 | 1,111 | 1,135 | 1,123 | 1,021 | 651 | 720 | 906 | 680 | 571 |
| 2023 | 781 | 877 | 734 | 588 | 663 | 892 | 923 | 877 | 852 | 1,214 | 653 | 999 |
| 2024 | 870 | |||||||||||
| - = No Data Reported; -- = Not Applicable; NA = Not Available; W = Withheld to avoid disclosure of individual company data. |
| Release Date: 3/29/2024 |
| Next Release Date: 4/30/2024 |