|
Download Data (XLS File) |
|
||||||||
|
||||||||
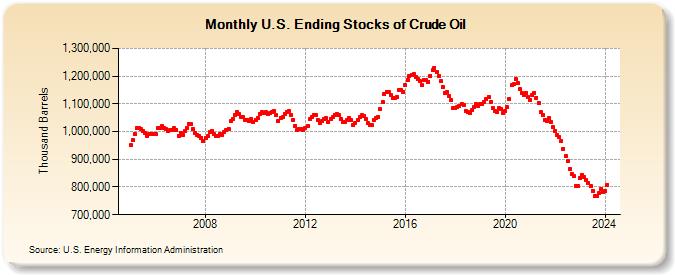
| U.S. Ending Stocks of Crude Oil (Thousand Barrels) | ||||||||
| Year | Jan | Feb | Mar | Apr | May | Jun | Jul | Aug | Sep | Oct | Nov | Dec |
|---|---|---|---|---|---|---|---|---|---|---|---|---|
| 2005 | 949,984 | 968,023 | 991,656 | 1,013,597 | 1,013,967 | 1,008,280 | 1,001,211 | 994,300 | 983,986 | 991,273 | 991,953 | 992,195 |
| 2006 | 990,662 | 1,011,152 | 1,012,471 | 1,019,145 | 1,012,886 | 1,008,370 | 1,003,232 | 1,004,462 | 1,004,436 | 1,011,522 | 1,006,789 | 984,424 |
| 2007 | 995,938 | 988,891 | 1,002,143 | 1,014,183 | 1,026,358 | 1,027,223 | 1,009,750 | 993,907 | 986,844 | 984,162 | 977,683 | 965,334 |
| 2008 | 977,076 | 983,449 | 997,590 | 1,003,707 | 990,403 | 984,209 | 985,063 | 992,226 | 988,897 | 996,991 | 1,005,839 | 1,010,068 |
| 2009 | 1,036,940 | 1,044,826 | 1,061,228 | 1,070,957 | 1,062,804 | 1,052,755 | 1,051,308 | 1,041,638 | 1,042,160 | 1,039,490 | 1,044,975 | 1,033,756 |
| 2010 | 1,042,716 | 1,048,983 | 1,065,046 | 1,069,234 | 1,067,876 | 1,071,579 | 1,063,603 | 1,065,300 | 1,068,831 | 1,073,380 | 1,057,989 | 1,038,627 |
| 2011 | 1,050,002 | 1,053,356 | 1,064,963 | 1,070,955 | 1,072,614 | 1,060,230 | 1,042,507 | 1,021,273 | 1,004,196 | 1,010,873 | 1,010,553 | 1,004,172 |
| 2012 | 1,013,833 | 1,018,830 | 1,043,559 | 1,052,996 | 1,059,710 | 1,058,104 | 1,042,627 | 1,032,341 | 1,038,294 | 1,044,483 | 1,047,363 | 1,033,064 |
| 2013 | 1,045,099 | 1,052,768 | 1,060,590 | 1,063,524 | 1,059,273 | 1,044,776 | 1,035,360 | 1,033,096 | 1,039,985 | 1,048,566 | 1,040,141 | 1,023,160 |
| 2014 | 1,032,207 | 1,041,243 | 1,050,916 | 1,058,654 | 1,056,432 | 1,045,277 | 1,029,709 | 1,022,048 | 1,023,124 | 1,042,683 | 1,047,692 | 1,051,824 |
| 2015 | 1,080,169 | 1,106,266 | 1,134,150 | 1,143,660 | 1,141,306 | 1,132,701 | 1,119,943 | 1,120,983 | 1,124,257 | 1,150,339 | 1,151,117 | 1,144,339 |
| 2016 | 1,166,883 | 1,187,267 | 1,199,923 | 1,204,430 | 1,206,965 | 1,195,957 | 1,188,554 | 1,181,768 | 1,166,627 | 1,186,290 | 1,185,818 | 1,179,704 |
| 2017 | 1,201,876 | 1,220,244 | 1,230,105 | 1,213,073 | 1,201,286 | 1,180,731 | 1,162,294 | 1,138,781 | 1,143,228 | 1,128,682 | 1,114,332 | 1,084,477 |
| 2018 | 1,084,994 | 1,089,301 | 1,090,395 | 1,100,544 | 1,094,364 | 1,075,167 | 1,069,654 | 1,067,594 | 1,076,693 | 1,088,648 | 1,098,946 | 1,091,640 |
| 2019 | 1,098,111 | 1,100,786 | 1,108,016 | 1,118,390 | 1,125,943 | 1,108,264 | 1,086,406 | 1,074,936 | 1,070,432 | 1,084,520 | 1,080,854 | 1,067,739 |
| 2020 | 1,075,220 | 1,087,530 | 1,118,308 | 1,166,861 | 1,169,919 | 1,188,680 | 1,176,264 | 1,151,929 | 1,139,910 | 1,132,478 | 1,138,837 | 1,123,557 |
| 2021 | 1,114,354 | 1,131,649 | 1,140,238 | 1,122,586 | 1,104,565 | 1,069,412 | 1,060,047 | 1,042,827 | 1,038,111 | 1,047,226 | 1,034,854 | 1,014,866 |
| 2022 | 1,002,031 | 987,398 | 980,268 | 965,248 | 938,174 | 911,123 | 892,081 | 864,842 | 845,393 | 838,247 | 805,040 | 802,132 |
| 2023 | 831,386 | 843,936 | 836,612 | 823,605 | 815,186 | 801,892 | 787,240 | 767,629 | 768,739 | 777,341 | 794,047 | 781,072 |
| 2024 | 785,870 | |||||||||||
| - = No Data Reported; -- = Not Applicable; NA = Not Available; W = Withheld to avoid disclosure of individual company data. |
| Release Date: 3/29/2024 |
| Next Release Date: 4/30/2024 |