|
Download Data (XLS File) |
|
||||||||
|
||||||||
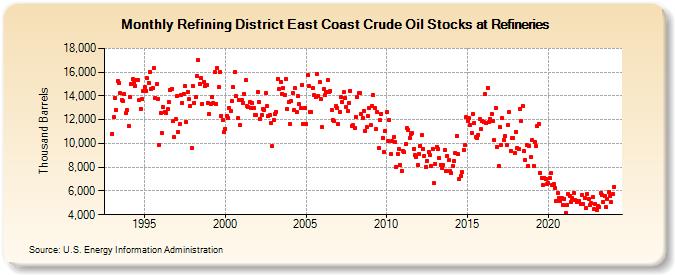
| Refining District East Coast Crude Oil Stocks at Refineries (Thousand Barrels) | ||||||||
| Year | Jan | Feb | Mar | Apr | May | Jun | Jul | Aug | Sep | Oct | Nov | Dec |
|---|---|---|---|---|---|---|---|---|---|---|---|---|
| 1993 | 10,827 | 12,193 | 13,810 | 12,817 | 15,254 | 15,078 | 14,204 | 13,652 | 13,541 | 14,127 | 12,524 | 12,798 |
| 1994 | 11,479 | 13,901 | 15,018 | 15,400 | 15,109 | 14,856 | 15,373 | 15,336 | 13,633 | 12,926 | 13,767 | 14,372 |
| 1995 | 14,743 | 14,449 | 15,473 | 15,096 | 16,040 | 14,609 | 14,659 | 16,313 | 13,832 | 14,987 | 13,772 | 9,899 |
| 1996 | 12,568 | 10,883 | 13,042 | 12,610 | 12,597 | 12,858 | 13,499 | 14,499 | 14,615 | 11,858 | 10,515 | 12,035 |
| 1997 | 13,953 | 10,965 | 11,598 | 14,064 | 13,407 | 14,178 | 14,846 | 11,830 | 14,332 | 13,728 | 13,188 | 9,601 |
| 1998 | 14,835 | 13,431 | 13,885 | 15,715 | 17,017 | 15,003 | 15,478 | 13,326 | 15,208 | 14,824 | 14,888 | 13,433 |
| 1999 | 12,474 | 13,303 | 13,938 | 13,424 | 15,971 | 13,349 | 16,339 | 14,713 | 16,029 | 12,326 | 11,969 | 10,924 |
| 2000 | 11,255 | 12,331 | 12,106 | 12,993 | 12,768 | 13,568 | 14,738 | 15,981 | 13,951 | 12,105 | 13,658 | 11,521 |
| 2001 | 13,640 | 13,444 | 14,188 | 15,311 | 13,117 | 13,094 | 13,463 | 13,016 | 13,422 | 12,971 | 12,427 | 12,368 |
| 2002 | 14,333 | 13,471 | 12,086 | 12,393 | 12,906 | 12,814 | 14,221 | 13,112 | 12,302 | 12,362 | 11,739 | 9,743 |
| 2003 | 11,977 | 12,443 | 12,677 | 15,423 | 14,582 | 15,201 | 14,186 | 14,678 | 14,043 | 15,456 | 12,881 | 13,466 |
| 2004 | 11,674 | 13,580 | 14,225 | 12,800 | 14,628 | 12,625 | 13,964 | 13,295 | 12,947 | 14,957 | 11,672 | 12,985 |
| 2005 | 11,656 | 15,750 | 14,867 | 12,641 | 12,646 | 14,637 | 14,052 | 13,917 | 15,870 | 14,032 | 15,183 | 13,748 |
| 2006 | 11,342 | 14,608 | 14,038 | 14,309 | 15,354 | 14,322 | 14,408 | 12,816 | 11,950 | 11,869 | 13,143 | 12,990 |
| 2007 | 11,613 | 12,668 | 13,881 | 13,488 | 14,290 | 13,804 | 13,075 | 12,735 | 13,425 | 14,442 | 11,443 | 11,525 |
| 2008 | 11,269 | 12,211 | 13,888 | 14,238 | 14,275 | 12,483 | 12,101 | 12,733 | 11,070 | 11,403 | 12,315 | 12,993 |
| 2009 | 11,551 | 13,166 | 14,064 | 13,008 | 11,242 | 12,613 | 9,587 | 11,961 | 12,519 | 10,487 | 9,272 | 11,072 |
| 2010 | 12,633 | 10,212 | 11,970 | 9,088 | 10,178 | 10,523 | 10,101 | 8,049 | 9,117 | 9,520 | 8,202 | 7,720 |
| 2011 | 9,369 | 9,248 | 9,921 | 11,274 | 11,122 | 10,468 | 10,757 | 10,863 | 9,562 | 8,997 | 8,878 | 8,170 |
| 2012 | 9,092 | 9,806 | 10,699 | 9,520 | 8,934 | 7,977 | 8,548 | 9,259 | 8,987 | 8,104 | 9,568 | 6,647 |
| 2013 | 8,294 | 9,712 | 9,553 | 8,767 | 8,187 | 7,905 | 8,166 | 9,454 | 7,701 | 8,955 | 8,570 | 7,657 |
| 2014 | 7,495 | 8,115 | 8,539 | 9,186 | 10,647 | 9,084 | 6,990 | 7,243 | 7,572 | 9,483 | 9,876 | 12,183 |
| 2015 | 11,905 | 12,109 | 11,566 | 10,918 | 12,485 | 11,741 | 10,542 | 10,485 | 10,738 | 12,034 | 11,179 | 11,877 |
| 2016 | 11,795 | 14,148 | 11,733 | 14,698 | 11,783 | 12,055 | 12,508 | 11,896 | 10,283 | 12,973 | 9,722 | 8,065 |
| 2017 | 11,354 | 9,865 | 12,122 | 10,252 | 10,588 | 9,826 | 11,529 | 12,628 | 9,361 | 10,466 | 10,471 | 9,172 |
| 2018 | 10,977 | 9,582 | 9,559 | 12,921 | 11,903 | 13,157 | 9,345 | 8,617 | 9,869 | 8,111 | 9,780 | 8,818 |
| 2019 | 10,288 | 8,123 | 10,091 | 9,779 | 11,426 | 11,670 | 7,542 | 7,098 | 6,500 | 7,117 | 7,015 | 6,548 |
| 2020 | 6,683 | 7,065 | 7,476 | 6,531 | 6,569 | 6,261 | 5,194 | 5,841 | 5,403 | 5,169 | 5,408 | 4,846 |
| 2021 | 5,329 | 4,150 | 4,830 | 5,722 | 5,580 | 5,076 | 5,446 | 5,824 | 5,257 | 5,043 | 5,134 | 5,185 |
| 2022 | 4,914 | 5,653 | 4,898 | 5,434 | 4,553 | 5,755 | 5,340 | 4,791 | 4,960 | 5,503 | 4,444 | 4,886 |
| 2023 | 4,388 | 4,757 | 4,658 | 5,822 | 5,659 | 5,053 | 5,546 | 4,610 | 5,331 | 5,891 | 5,606 | 5,032 |
| 2024 | 5,726 | |||||||||||
| - = No Data Reported; -- = Not Applicable; NA = Not Available; W = Withheld to avoid disclosure of individual company data. |
| Release Date: 3/29/2024 |
| Next Release Date: 4/30/2024 |
Referring Pages: