|
Download Data (XLS File) |
|
||||||||
|
||||||||
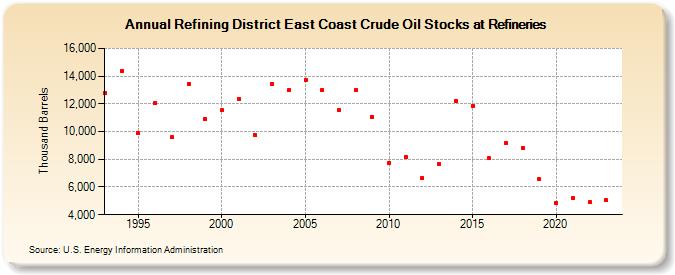
| Refining District East Coast Crude Oil Stocks at Refineries (Thousand Barrels) | ||||||||
| Decade | Year-0 | Year-1 | Year-2 | Year-3 | Year-4 | Year-5 | Year-6 | Year-7 | Year-8 | Year-9 |
|---|---|---|---|---|---|---|---|---|---|---|
| 1990's | 12,798 | 14,372 | 9,899 | 12,035 | 9,601 | 13,433 | 10,924 | |||
| 2000's | 11,521 | 12,368 | 9,743 | 13,466 | 12,985 | 13,748 | 12,990 | 11,525 | 12,993 | 11,072 |
| 2010's | 7,720 | 8,170 | 6,647 | 7,657 | 12,183 | 11,877 | 8,065 | 9,172 | 8,818 | 6,548 |
| 2020's | 4,846 | 5,185 | 4,886 | 5,032 |
| - = No Data Reported; -- = Not Applicable; NA = Not Available; W = Withheld to avoid disclosure of individual company data. |
| Release Date: 8/30/2024 |
| Next Release Date: 8/29/2025 |
Referring Pages: