|
Download Data (XLS File) |
|
||||||||
|
||||||||
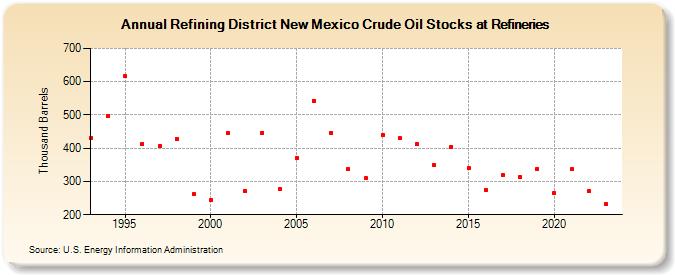
| Refining District New Mexico Crude Oil Stocks at Refineries (Thousand Barrels) | ||||||||
| Decade | Year-0 | Year-1 | Year-2 | Year-3 | Year-4 | Year-5 | Year-6 | Year-7 | Year-8 | Year-9 |
|---|---|---|---|---|---|---|---|---|---|---|
| 1990's | 430 | 498 | 616 | 414 | 406 | 429 | 263 | |||
| 2000's | 244 | 446 | 271 | 447 | 276 | 371 | 543 | 447 | 338 | 309 |
| 2010's | 440 | 430 | 412 | 349 | 404 | 339 | 275 | 320 | 314 | 338 |
| 2020's | 265 | 336 | 270 | 231 |
| - = No Data Reported; -- = Not Applicable; NA = Not Available; W = Withheld to avoid disclosure of individual company data. |
| Release Date: 8/30/2024 |
| Next Release Date: 8/29/2025 |
Referring Pages: