|
Download Data (XLS File) |
|
||||||||
|
||||||||
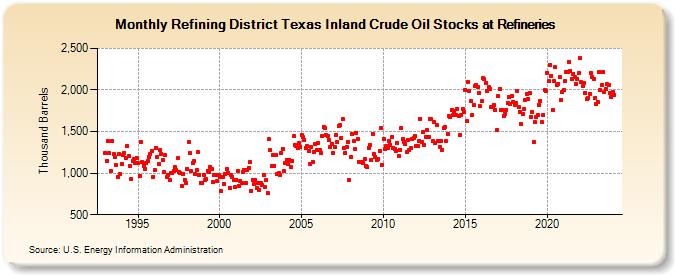
| Refining District Texas Inland Crude Oil Stocks at Refineries (Thousand Barrels) | ||||||||
| Year | Jan | Feb | Mar | Apr | May | Jun | Jul | Aug | Sep | Oct | Nov | Dec |
|---|---|---|---|---|---|---|---|---|---|---|---|---|
| 1993 | 1,241 | 1,148 | 1,381 | 1,248 | 1,022 | 1,390 | 1,229 | 1,189 | 1,100 | 958 | 1,232 | 987 |
| 1994 | 1,112 | 1,218 | 1,243 | 1,184 | 1,329 | 1,206 | 1,086 | 935 | 1,151 | 1,172 | 1,119 | 1,185 |
| 1995 | 1,117 | 962 | 1,375 | 1,133 | 1,090 | 1,055 | 1,117 | 1,148 | 1,191 | 1,236 | 1,265 | 958 |
| 1996 | 1,033 | 1,307 | 1,197 | 1,109 | 1,277 | 1,232 | 1,159 | 1,014 | 1,216 | 952 | 980 | 912 |
| 1997 | 1,000 | 1,002 | 1,027 | 1,068 | 1,037 | 1,178 | 1,018 | 998 | 846 | 995 | 920 | 887 |
| 1998 | 1,049 | 1,369 | 1,242 | 1,021 | 1,126 | 1,141 | 991 | 1,037 | 1,250 | 978 | 887 | 884 |
| 1999 | 975 | 917 | 925 | 1,029 | 1,012 | 1,070 | 1,045 | 888 | 972 | 977 | 906 | 978 |
| 2000 | 957 | 785 | 958 | 868 | 986 | 1,046 | 997 | 823 | 979 | 957 | 919 | 835 |
| 2001 | 920 | 1,028 | 851 | 906 | 882 | 1,014 | 1,042 | 885 | 1,039 | 1,060 | 1,128 | 789 |
| 2002 | 921 | 865 | 913 | 821 | 884 | 800 | 882 | 855 | 974 | 829 | 914 | 759 |
| 2003 | 1,406 | 1,278 | 1,084 | 1,215 | 1,081 | 1,218 | 986 | 997 | 975 | 1,245 | 1,296 | 1,020 |
| 2004 | 1,124 | 1,162 | 1,109 | 1,161 | 1,072 | 1,146 | 1,444 | 1,339 | 1,330 | 1,301 | 1,357 | 1,317 |
| 2005 | 1,459 | 1,430 | 1,401 | 1,303 | 1,321 | 1,264 | 1,106 | 1,311 | 1,138 | 1,256 | 1,348 | 1,281 |
| 2006 | 1,364 | 1,274 | 1,248 | 1,449 | 1,558 | 1,545 | 1,454 | 1,451 | 1,394 | 1,313 | 1,352 | 1,243 |
| 2007 | 1,313 | 1,462 | 1,378 | 1,568 | 1,573 | 1,428 | 1,647 | 1,301 | 1,246 | 1,318 | 1,375 | 912 |
| 2008 | 1,194 | 1,473 | 1,383 | 1,285 | 1,481 | 1,416 | 1,136 | 1,136 | 1,137 | 1,122 | 1,164 | 1,085 |
| 2009 | 1,068 | 1,307 | 1,341 | 1,158 | 1,476 | 1,233 | 1,192 | 1,161 | 1,166 | 1,267 | 1,540 | 1,100 |
| 2010 | 1,414 | 1,294 | 1,322 | 1,299 | 1,382 | 1,339 | 1,430 | 1,303 | 1,287 | 1,271 | 1,368 | 1,204 |
| 2011 | 1,283 | 1,537 | 1,407 | 1,379 | 1,347 | 1,253 | 1,402 | 1,277 | 1,299 | 1,414 | 1,425 | 1,448 |
| 2012 | 1,328 | 1,322 | 1,388 | 1,656 | 1,372 | 1,490 | 1,342 | 1,435 | 1,514 | 1,440 | 1,655 | 1,649 |
| 2013 | 1,383 | 1,615 | 1,359 | 1,575 | 1,381 | 1,313 | 1,387 | 1,283 | 1,538 | 1,553 | 1,382 | 1,468 |
| 2014 | 1,682 | 1,680 | 1,764 | 1,704 | 1,746 | 1,701 | 1,770 | 1,687 | 1,458 | 1,699 | 1,771 | 1,739 |
| 2015 | 2,003 | 1,623 | 2,099 | 1,988 | 1,863 | 1,704 | 1,821 | 2,050 | 2,059 | 2,033 | 1,962 | 1,806 |
| 2016 | 1,862 | 2,138 | 2,130 | 2,089 | 1,991 | 2,033 | 2,009 | 1,793 | 1,792 | 1,822 | 1,755 | 1,520 |
| 2017 | 1,925 | 2,015 | 1,755 | 1,764 | 1,686 | 1,712 | 1,761 | 1,839 | 1,919 | 1,831 | 1,926 | 1,856 |
| 2018 | 1,820 | 1,846 | 1,987 | 1,797 | 1,741 | 1,585 | 1,716 | 1,772 | 1,882 | 1,951 | 1,888 | 1,958 |
| 2019 | 1,681 | 1,734 | 1,373 | 1,610 | 1,669 | 1,697 | 1,823 | 1,868 | 1,610 | 1,702 | 1,995 | 1,982 |
| 2020 | 2,208 | 2,104 | 2,306 | 2,167 | 1,759 | 2,102 | 2,273 | 2,055 | 2,070 | 2,157 | 1,877 | 1,977 |
| 2021 | 2,001 | 2,107 | 2,217 | 2,222 | 2,340 | 2,229 | 2,133 | 2,198 | 2,158 | 2,070 | 2,135 | 2,199 |
| 2022 | 2,383 | 2,092 | 2,046 | 2,078 | 1,969 | 1,894 | 1,906 | 1,955 | 2,206 | 2,153 | 2,126 | 1,907 |
| 2023 | 1,834 | 1,851 | 2,214 | 1,999 | 2,059 | 2,214 | 1,979 | 2,015 | 2,066 | 2,063 | 1,966 | 1,912 |
| 2024 | 1,978 | |||||||||||
| - = No Data Reported; -- = Not Applicable; NA = Not Available; W = Withheld to avoid disclosure of individual company data. |
| Release Date: 3/29/2024 |
| Next Release Date: 4/30/2024 |
Referring Pages: