|
Download Data (XLS File) |
|
||||||||
|
||||||||
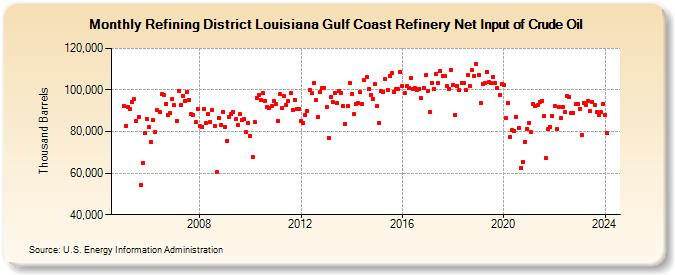
| Refining District Louisiana Gulf Coast Refinery Net Input of Crude Oil (Thousand Barrels) | ||||||||
| Year | Jan | Feb | Mar | Apr | May | Jun | Jul | Aug | Sep | Oct | Nov | Dec |
|---|---|---|---|---|---|---|---|---|---|---|---|---|
| 2005 | 92,308 | 82,894 | 91,717 | 91,066 | 94,083 | 95,481 | 85,197 | 87,036 | 54,208 | 64,672 | 79,199 | 86,083 |
| 2006 | 82,012 | 75,156 | 85,331 | 79,942 | 90,225 | 89,254 | 97,881 | 97,516 | 93,430 | 87,958 | 88,852 | 95,714 |
| 2007 | 92,563 | 85,052 | 99,488 | 92,763 | 97,288 | 94,883 | 99,164 | 95,040 | 88,209 | 87,928 | 84,560 | 90,847 |
| 2008 | 82,685 | 82,290 | 90,847 | 84,089 | 88,547 | 84,629 | 90,463 | 82,768 | 60,363 | 86,746 | 83,101 | 89,622 |
| 2009 | 82,374 | 75,671 | 86,989 | 88,435 | 89,380 | 85,978 | 83,179 | 88,245 | 85,321 | 85,936 | 79,658 | 84,043 |
| 2010 | 77,650 | 67,883 | 84,703 | 96,366 | 97,721 | 95,221 | 98,427 | 94,670 | 91,837 | 91,192 | 92,170 | 94,684 |
| 2011 | 93,081 | 85,089 | 98,022 | 91,184 | 96,976 | 92,573 | 94,846 | 98,411 | 90,429 | 95,269 | 90,940 | 91,075 |
| 2012 | 85,041 | 83,899 | 87,930 | 89,755 | 99,909 | 98,428 | 103,445 | 95,281 | 86,941 | 99,209 | 101,176 | 101,062 |
| 2013 | 91,691 | 77,054 | 96,452 | 94,426 | 98,533 | 93,565 | 99,335 | 98,569 | 92,289 | 83,566 | 92,181 | 103,493 |
| 2014 | 98,008 | 88,382 | 93,394 | 93,557 | 98,894 | 93,231 | 104,609 | 106,011 | 100,324 | 97,465 | 95,882 | 102,805 |
| 2015 | 92,059 | 84,239 | 99,314 | 98,917 | 105,149 | 100,149 | 106,642 | 108,062 | 99,199 | 100,352 | 100,472 | 108,580 |
| 2016 | 101,949 | 98,616 | 101,800 | 101,028 | 105,894 | 100,387 | 100,876 | 100,118 | 100,615 | 96,126 | 101,117 | 107,172 |
| 2017 | 99,399 | 89,430 | 103,169 | 100,518 | 107,857 | 103,293 | 109,002 | 106,717 | 106,494 | 101,796 | 100,505 | 109,776 |
| 2018 | 102,611 | 88,158 | 101,919 | 99,871 | 103,576 | 103,260 | 99,999 | 107,312 | 101,710 | 109,377 | 106,838 | 112,361 |
| 2019 | 107,233 | 93,929 | 102,953 | 103,249 | 108,782 | 103,688 | 103,189 | 106,104 | 103,208 | 100,945 | 97,815 | 103,010 |
| 2020 | 102,379 | 86,289 | 93,722 | 77,313 | 80,837 | 80,053 | 87,128 | 81,746 | 62,701 | 65,495 | 75,122 | 81,375 |
| 2021 | 84,348 | 79,636 | 93,447 | 92,072 | 92,556 | 94,049 | 94,903 | 87,382 | 67,186 | 81,284 | 82,120 | 87,695 |
| 2022 | 92,183 | 81,160 | 91,759 | 86,385 | 91,990 | 89,317 | 97,246 | 96,390 | 88,738 | 88,985 | 93,275 | 93,257 |
| 2023 | 90,881 | 78,113 | 93,973 | 92,568 | 94,722 | 89,737 | 94,091 | 92,591 | 89,611 | 88,138 | 89,168 | 93,452 |
| 2024 | 88,141 | |||||||||||
| - = No Data Reported; -- = Not Applicable; NA = Not Available; W = Withheld to avoid disclosure of individual company data. |
| Release Date: 3/29/2024 |
| Next Release Date: 4/30/2024 |
Referring Pages: