|
Download Data (XLS File) |
|
||||||||
|
||||||||
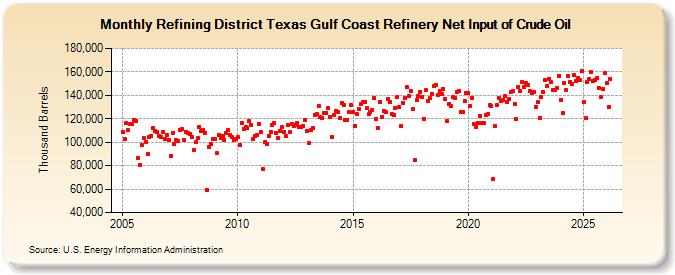
| Refining District Texas Gulf Coast Refinery Net Input of Crude Oil (Thousand Barrels) | ||||||||
| Year | Jan | Feb | Mar | Apr | May | Jun | Jul | Aug | Sep | Oct | Nov | Dec |
|---|---|---|---|---|---|---|---|---|---|---|---|---|
| 2005 | 108,422 | 102,340 | 116,209 | 110,102 | 115,157 | 115,726 | 119,285 | 118,151 | 86,484 | 80,553 | 97,587 | 103,287 |
| 2006 | 99,995 | 90,313 | 104,613 | 105,656 | 111,829 | 109,670 | 108,806 | 105,357 | 104,318 | 108,328 | 102,752 | 105,751 |
| 2007 | 102,106 | 88,231 | 108,006 | 98,758 | 102,135 | 101,104 | 110,049 | 111,368 | 101,768 | 109,104 | 107,578 | 106,873 |
| 2008 | 104,645 | 93,698 | 100,175 | 103,287 | 113,059 | 109,515 | 110,521 | 108,091 | 58,899 | 95,779 | 98,823 | 102,706 |
| 2009 | 102,539 | 90,434 | 105,991 | 103,985 | 105,292 | 101,919 | 108,208 | 110,573 | 105,814 | 104,285 | 101,713 | 102,930 |
| 2010 | 104,240 | 97,450 | 116,399 | 111,676 | 112,756 | 111,887 | 118,310 | 114,429 | 102,582 | 105,426 | 106,170 | 115,802 |
| 2011 | 108,409 | 77,005 | 99,766 | 98,507 | 104,921 | 108,998 | 114,650 | 116,690 | 107,965 | 103,425 | 109,720 | 112,718 |
| 2012 | 108,705 | 105,166 | 114,291 | 108,456 | 115,608 | 113,841 | 114,961 | 116,378 | 112,900 | 113,322 | 113,949 | 119,101 |
| 2013 | 109,232 | 99,051 | 110,297 | 112,330 | 123,019 | 124,390 | 130,923 | 121,786 | 120,785 | 125,164 | 125,116 | 128,873 |
| 2014 | 121,305 | 104,263 | 123,599 | 126,508 | 126,071 | 120,266 | 133,501 | 131,425 | 119,260 | 119,324 | 125,462 | 132,037 |
| 2015 | 126,058 | 114,087 | 123,851 | 128,564 | 132,488 | 134,101 | 134,581 | 129,106 | 123,633 | 125,696 | 127,752 | 137,743 |
| 2016 | 119,846 | 112,203 | 134,106 | 121,856 | 126,836 | 125,745 | 136,450 | 134,561 | 123,843 | 123,133 | 128,927 | 138,329 |
| 2017 | 130,311 | 113,648 | 133,768 | 137,372 | 146,838 | 139,241 | 143,878 | 127,980 | 84,738 | 135,655 | 139,618 | 143,197 |
| 2018 | 138,402 | 119,373 | 144,645 | 135,117 | 137,500 | 141,505 | 147,660 | 148,899 | 140,448 | 143,923 | 140,929 | 145,718 |
| 2019 | 136,557 | 117,743 | 132,214 | 130,634 | 138,255 | 138,089 | 142,894 | 143,259 | 125,980 | 125,930 | 134,874 | 142,130 |
| 2020 | 141,541 | 130,498 | 137,803 | 115,129 | 113,235 | 115,971 | 122,570 | 115,978 | 116,484 | 123,325 | 123,877 | 131,459 |
| 2021 | 130,969 | 69,027 | 113,650 | 131,412 | 137,558 | 135,282 | 135,747 | 138,988 | 134,365 | 137,042 | 142,532 | 143,592 |
| 2022 | 132,990 | 120,156 | 147,025 | 143,544 | 151,395 | 146,872 | 150,711 | 148,931 | 143,751 | 141,640 | 143,043 | 130,360 |
| 2023 | 134,160 | 120,937 | 138,190 | 142,877 | 152,816 | 148,091 | 153,514 | 151,038 | 144,750 | 144,709 | 146,326 | 156,412 |
| 2024 | 136,079 | |||||||||||
| - = No Data Reported; -- = Not Applicable; NA = Not Available; W = Withheld to avoid disclosure of individual company data. |
| Release Date: 3/29/2024 |
| Next Release Date: 4/30/2024 |
Referring Pages: