|
Download Data (XLS File) |
|
||||||||
|
||||||||
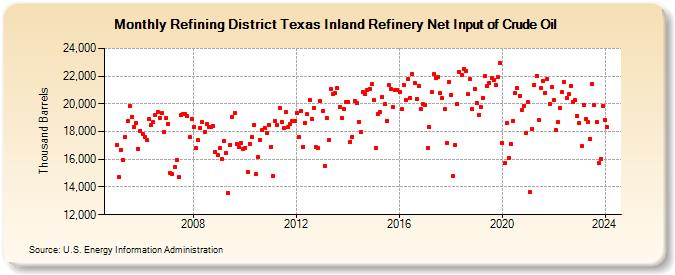
| Refining District Texas Inland Refinery Net Input of Crude Oil (Thousand Barrels) | ||||||||
| Year | Jan | Feb | Mar | Apr | May | Jun | Jul | Aug | Sep | Oct | Nov | Dec |
|---|---|---|---|---|---|---|---|---|---|---|---|---|
| 2005 | 17,058 | 14,704 | 16,685 | 15,941 | 17,619 | 18,743 | 19,809 | 19,048 | 18,327 | 18,636 | 16,767 | 18,068 |
| 2006 | 17,789 | 17,605 | 17,388 | 18,917 | 18,452 | 18,664 | 19,194 | 19,404 | 18,994 | 19,329 | 17,990 | 19,011 |
| 2007 | 18,532 | 14,999 | 14,972 | 15,449 | 15,958 | 14,698 | 19,190 | 19,285 | 19,294 | 19,099 | 17,595 | 18,941 |
| 2008 | 18,314 | 16,824 | 17,359 | 18,257 | 18,676 | 17,970 | 18,567 | 18,351 | 18,329 | 18,431 | 16,540 | 16,283 |
| 2009 | 16,781 | 15,987 | 17,347 | 16,440 | 13,570 | 17,057 | 19,057 | 19,349 | 17,105 | 16,879 | 17,208 | 16,727 |
| 2010 | 16,846 | 15,096 | 17,084 | 17,596 | 18,484 | 14,905 | 16,176 | 17,417 | 18,077 | 18,279 | 17,906 | 18,448 |
| 2011 | 16,899 | 14,790 | 18,762 | 18,479 | 19,704 | 18,709 | 18,230 | 19,384 | 18,314 | 18,518 | 18,727 | 18,730 |
| 2012 | 19,365 | 17,581 | 19,507 | 16,913 | 18,641 | 19,238 | 20,278 | 18,915 | 19,719 | 16,885 | 16,807 | 20,169 |
| 2013 | 19,500 | 15,509 | 18,999 | 17,357 | 21,041 | 20,724 | 20,747 | 21,160 | 19,774 | 19,005 | 19,597 | 20,103 |
| 2014 | 20,168 | 17,277 | 17,643 | 20,215 | 20,083 | 18,710 | 17,976 | 20,887 | 20,699 | 21,011 | 21,085 | 21,461 |
| 2015 | 20,311 | 16,844 | 19,249 | 19,407 | 20,493 | 19,954 | 18,727 | 21,372 | 21,042 | 19,743 | 20,971 | 21,005 |
| 2016 | 20,865 | 19,606 | 21,358 | 20,304 | 21,762 | 20,441 | 22,146 | 21,519 | 20,332 | 21,308 | 19,614 | 19,979 |
| 2017 | 19,938 | 16,791 | 18,333 | 20,847 | 22,151 | 21,842 | 21,938 | 20,749 | 20,396 | 19,601 | 17,184 | 21,587 |
| 2018 | 20,627 | 14,760 | 17,058 | 20,001 | 22,288 | 22,087 | 22,535 | 22,359 | 20,689 | 21,758 | 19,602 | 21,079 |
| 2019 | 20,045 | 19,227 | 19,803 | 20,404 | 22,005 | 21,280 | 21,526 | 21,872 | 21,746 | 21,363 | 21,943 | 22,944 |
| 2020 | 17,171 | 15,699 | 18,615 | 16,092 | 17,127 | 18,792 | 20,794 | 21,121 | 20,568 | 19,590 | 19,871 | 17,907 |
| 2021 | 20,106 | 13,622 | 18,208 | 21,352 | 22,002 | 18,800 | 21,140 | 21,655 | 20,806 | 21,776 | 19,990 | 21,179 |
| 2022 | 20,259 | 18,100 | 18,675 | 19,687 | 20,822 | 21,576 | 20,434 | 20,676 | 21,297 | 20,138 | 20,274 | 19,142 |
| 2023 | 18,620 | 16,927 | 19,921 | 18,874 | 18,654 | 17,481 | 21,453 | 19,885 | 18,701 | 15,708 | 16,011 | 19,844 |
| 2024 | 18,812 | |||||||||||
| - = No Data Reported; -- = Not Applicable; NA = Not Available; W = Withheld to avoid disclosure of individual company data. |
| Release Date: 3/29/2024 |
| Next Release Date: 4/30/2024 |
Referring Pages: