|
Download Data (XLS File) |
|
||||||||
|
||||||||
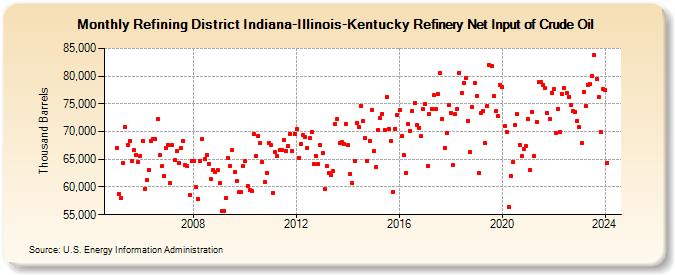
| Refining District Indiana-Illinois-Kentucky Refinery Net Input of Crude Oil (Thousand Barrels) | ||||||||
| Year | Jan | Feb | Mar | Apr | May | Jun | Jul | Aug | Sep | Oct | Nov | Dec |
|---|---|---|---|---|---|---|---|---|---|---|---|---|
| 2005 | 67,082 | 58,817 | 58,025 | 64,305 | 70,904 | 67,553 | 68,345 | 64,651 | 66,640 | 65,829 | 64,445 | 65,560 |
| 2006 | 68,232 | 59,704 | 61,342 | 63,154 | 68,365 | 68,573 | 68,609 | 72,194 | 65,682 | 63,732 | 62,003 | 67,114 |
| 2007 | 67,530 | 60,703 | 67,569 | 64,779 | 66,480 | 64,366 | 67,000 | 68,253 | 63,886 | 63,777 | 58,643 | 64,743 |
| 2008 | 64,609 | 59,994 | 57,749 | 64,697 | 68,692 | 65,124 | 65,786 | 64,173 | 61,363 | 63,100 | 62,709 | 62,988 |
| 2009 | 60,655 | 55,627 | 55,656 | 58,091 | 65,253 | 63,765 | 66,646 | 62,711 | 60,999 | 59,051 | 59,131 | 63,754 |
| 2010 | 64,642 | 60,225 | 59,439 | 59,192 | 69,586 | 65,667 | 69,253 | 67,909 | 64,483 | 60,951 | 62,614 | 67,960 |
| 2011 | 67,558 | 58,937 | 66,250 | 65,516 | 66,643 | 66,646 | 68,535 | 66,435 | 67,477 | 69,628 | 66,460 | 69,617 |
| 2012 | 70,449 | 65,190 | 67,826 | 69,347 | 69,018 | 67,087 | 68,753 | 69,985 | 64,118 | 65,560 | 64,062 | 67,532 |
| 2013 | 66,167 | 59,682 | 63,816 | 62,499 | 62,135 | 62,816 | 71,429 | 72,193 | 67,983 | 68,153 | 67,677 | 71,412 |
| 2014 | 67,499 | 62,351 | 60,720 | 64,674 | 71,604 | 70,824 | 74,697 | 71,847 | 68,846 | 64,741 | 68,313 | 73,855 |
| 2015 | 66,521 | 63,619 | 70,271 | 72,376 | 73,207 | 70,357 | 76,230 | 70,502 | 68,238 | 59,079 | 70,518 | 73,016 |
| 2016 | 73,800 | 69,156 | 65,750 | 62,503 | 71,350 | 70,174 | 73,745 | 75,135 | 71,135 | 70,650 | 69,138 | 74,011 |
| 2017 | 74,993 | 63,782 | 73,207 | 74,126 | 76,522 | 74,140 | 76,818 | 80,578 | 72,232 | 67,044 | 69,688 | 74,795 |
| 2018 | 73,295 | 63,954 | 73,099 | 73,989 | 80,624 | 76,961 | 78,754 | 79,720 | 71,973 | 66,286 | 74,452 | 78,834 |
| 2019 | 76,479 | 62,504 | 73,290 | 73,704 | 67,871 | 74,544 | 82,069 | 81,867 | 76,350 | 73,629 | 72,716 | 78,480 |
| 2020 | 78,032 | 70,948 | 69,889 | 56,434 | 61,920 | 64,510 | 71,145 | 73,150 | 67,529 | 65,563 | 66,859 | 67,371 |
| 2021 | 72,213 | 63,115 | 73,606 | 65,629 | 71,791 | 78,914 | 78,983 | 78,381 | 77,790 | 73,346 | 72,248 | 77,038 |
| 2022 | 77,673 | 69,668 | 74,106 | 69,928 | 76,822 | 77,807 | 76,932 | 76,304 | 74,796 | 73,650 | 73,606 | 71,904 |
| 2023 | 70,794 | 67,946 | 77,212 | 74,590 | 78,477 | 78,554 | 80,075 | 83,833 | 79,556 | 76,227 | 69,976 | 77,688 |
| 2024 | 77,437 | |||||||||||
| - = No Data Reported; -- = Not Applicable; NA = Not Available; W = Withheld to avoid disclosure of individual company data. |
| Release Date: 3/29/2024 |
| Next Release Date: 4/30/2024 |