|
Download Data (XLS File) |
|
||||||||
|
||||||||
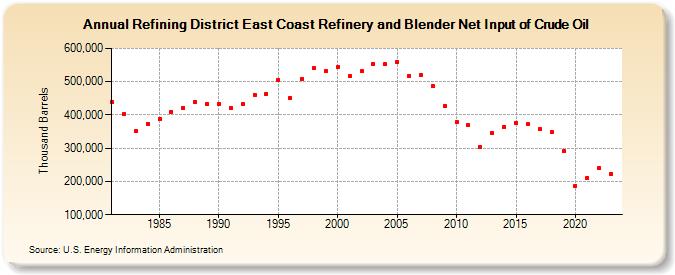
| Refining District East Coast Refinery and Blender Net Input of Crude Oil (Thousand Barrels) | ||||||||
| Decade | Year-0 | Year-1 | Year-2 | Year-3 | Year-4 | Year-5 | Year-6 | Year-7 | Year-8 | Year-9 |
|---|---|---|---|---|---|---|---|---|---|---|
| 1980's | 438,657 | 402,691 | 350,401 | 372,900 | 387,395 | 409,703 | 420,938 | 438,412 | 434,133 | |
| 1990's | 434,089 | 420,251 | 431,505 | 460,697 | 463,896 | 505,767 | 452,204 | 508,755 | 540,175 | 531,318 |
| 2000's | 543,524 | 515,781 | 531,230 | 553,518 | 551,861 | 559,841 | 517,613 | 520,629 | 487,377 | 427,376 |
| 2010's | 378,397 | 368,237 | 302,582 | 346,210 | 365,138 | 375,533 | 371,310 | 357,462 | 348,418 | 291,680 |
| 2020's | 187,080 | 211,802 | 241,001 | 222,146 |
| - = No Data Reported; -- = Not Applicable; NA = Not Available; W = Withheld to avoid disclosure of individual company data. |
| Release Date: 3/29/2024 |
| Next Release Date: 8/30/2024 |