|
Download Data (XLS File) |
|
||||||||
|
||||||||
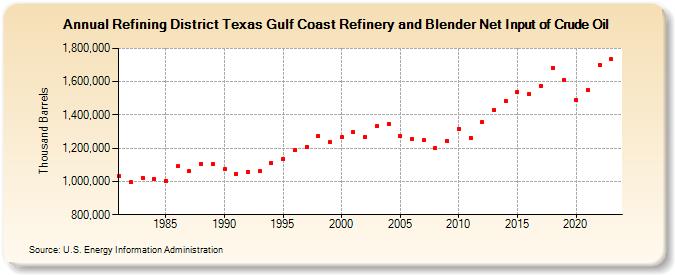
| Refining District Texas Gulf Coast Refinery and Blender Net Input of Crude Oil (Thousand Barrels) | ||||||||
| Decade | Year-0 | Year-1 | Year-2 | Year-3 | Year-4 | Year-5 | Year-6 | Year-7 | Year-8 | Year-9 |
|---|---|---|---|---|---|---|---|---|---|---|
| 1980's | 1,032,519 | 995,152 | 1,022,471 | 1,017,418 | 1,003,638 | 1,091,323 | 1,061,778 | 1,105,753 | 1,104,524 | |
| 1990's | 1,072,854 | 1,044,979 | 1,058,276 | 1,060,450 | 1,110,370 | 1,134,832 | 1,186,198 | 1,208,367 | 1,274,024 | 1,234,956 |
| 2000's | 1,264,397 | 1,295,345 | 1,268,310 | 1,332,868 | 1,347,758 | 1,273,303 | 1,257,388 | 1,247,080 | 1,199,198 | 1,243,683 |
| 2010's | 1,317,127 | 1,262,774 | 1,356,678 | 1,430,966 | 1,483,021 | 1,537,660 | 1,525,835 | 1,576,244 | 1,684,119 | 1,608,559 |
| 2020's | 1,487,870 | 1,550,164 | 1,700,418 | 1,733,820 |
| - = No Data Reported; -- = Not Applicable; NA = Not Available; W = Withheld to avoid disclosure of individual company data. |
| Release Date: 8/30/2024 |
| Next Release Date: 8/29/2025 |