|
Download Data (XLS File) |
|
||||||||
|
||||||||
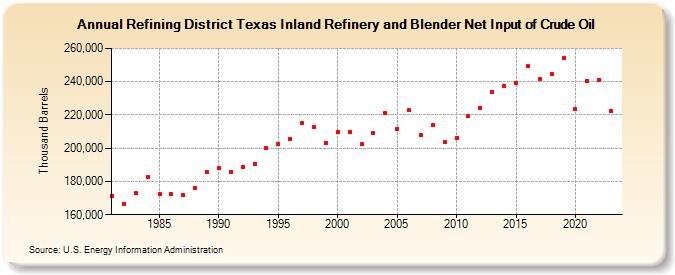
| Refining District Texas Inland Refinery and Blender Net Input of Crude Oil (Thousand Barrels) | ||||||||
| Decade | Year-0 | Year-1 | Year-2 | Year-3 | Year-4 | Year-5 | Year-6 | Year-7 | Year-8 | Year-9 |
|---|---|---|---|---|---|---|---|---|---|---|
| 1980's | 171,264 | 166,422 | 172,976 | 182,686 | 172,188 | 172,224 | 171,655 | 175,787 | 185,389 | |
| 1990's | 187,930 | 185,616 | 188,888 | 190,466 | 199,926 | 202,613 | 205,245 | 215,081 | 212,513 | 203,260 |
| 2000's | 209,553 | 209,646 | 202,258 | 208,923 | 221,109 | 211,405 | 222,737 | 208,012 | 213,901 | 203,507 |
| 2010's | 206,314 | 219,246 | 224,018 | 233,516 | 237,215 | 239,118 | 249,234 | 241,357 | 244,843 | 254,158 |
| 2020's | 223,347 | 240,636 | 241,080 | 222,079 |
| - = No Data Reported; -- = Not Applicable; NA = Not Available; W = Withheld to avoid disclosure of individual company data. |
| Release Date: 3/29/2024 |
| Next Release Date: 8/30/2024 |