|
Download Data (XLS File) |
|
||||||||
|
||||||||
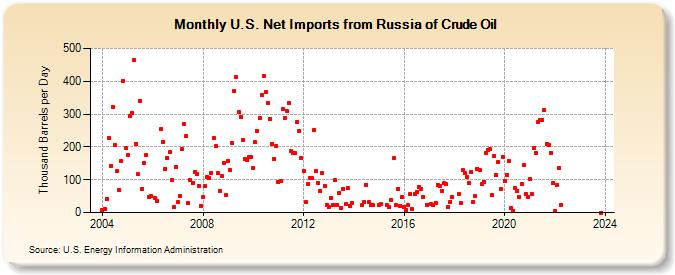
| U.S. Net Imports from Russia of Crude Oil (Thousand Barrels per Day) | ||||||||
| Year | Jan | Feb | Mar | Apr | May | Jun | Jul | Aug | Sep | Oct | Nov | Dec |
|---|---|---|---|---|---|---|---|---|---|---|---|---|
| 2004 | 8 | 11 | 42 | 228 | 142 | 321 | 206 | 126 | 68 | 156 | 402 | 196 |
| 2005 | 176 | 294 | 304 | 464 | 209 | 116 | 341 | 72 | 150 | 175 | 47 | 50 |
| 2006 | 43 | 34 | 255 | 216 | 134 | 167 | 183 | 98 | 16 | 139 | ||
| 2007 | 31 | 49 | 193 | 269 | 232 | 29 | 99 | 90 | 124 | 118 | 81 | 21 |
| 2008 | 46 | 80 | 108 | 106 | 119 | 228 | 202 | 120 | 65 | 111 | 152 | 54 |
| 2009 | 158 | 129 | 211 | 370 | 412 | 305 | 292 | 221 | 163 | 159 | 168 | 168 |
| 2010 | 137 | 214 | 248 | 288 | 358 | 416 | 367 | 334 | 286 | 210 | 164 | 202 |
| 2011 | 92 | 97 | 314 | 288 | 309 | 335 | 188 | 181 | 180 | 277 | 249 | 165 |
| 2012 | 126 | 32 | 88 | 106 | 104 | 252 | 126 | 91 | 65 | 119 | 81 | 24 |
| 2013 | 17 | 44 | 24 | 98 | 24 | 61 | 15 | 72 | 25 | 75 | 21 | 30 |
| 2014 | 23 | 32 | 85 | 31 | 24 | 23 | ||||||
| 2015 | 23 | 25 | 23 | 16 | 39 | 165 | 24 | 73 | 20 | 47 | ||
| 2016 | 16 | 9 | 23 | 57 | 11 | 57 | 64 | 78 | 73 | 46 | 24 | |
| 2017 | 25 | 23 | 30 | 85 | 80 | 67 | 89 | 86 | 18 | 33 | 47 | |
| 2018 | 57 | 30 | 130 | 119 | 107 | 90 | 123 | 33 | 49 | 134 | ||
| 2019 | 129 | 86 | 94 | 182 | 190 | 193 | 54 | 172 | 113 | 155 | 71 | 169 |
| 2020 | 95 | 114 | 158 | 13 | 4 | 75 | 67 | 47 | 86 | 145 | 57 | 46 |
| 2021 | 102 | 56 | 197 | 182 | 277 | 282 | 282 | 311 | 208 | 206 | 182 | 90 |
| 2022 | 4 | 83 | 136 | 24 | ||||||||
| 2023 | 0 | |||||||||||
| - = No Data Reported; -- = Not Applicable; NA = Not Available; W = Withheld to avoid disclosure of individual company data. |
| Release Date: 3/29/2024 |
| Next Release Date: 4/30/2024 |