|
Download Data (XLS File) |
|
||||||||
|
||||||||
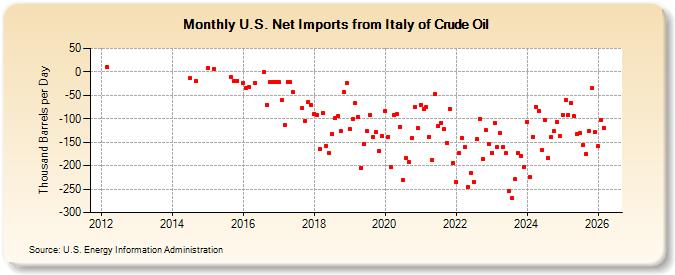
| U.S. Net Imports from Italy of Crude Oil (Thousand Barrels per Day) | ||||||||
| Year | Jan | Feb | Mar | Apr | May | Jun | Jul | Aug | Sep | Oct | Nov | Dec |
|---|---|---|---|---|---|---|---|---|---|---|---|---|
| 2012 | 10 | |||||||||||
| 2014 | -14 | -19 | ||||||||||
| 2015 | 8 | 7 | -11 | -20 | -20 | |||||||
| 2016 | -23 | -34 | -33 | -23 | 0 | -70 | -22 | -22 | -21 | |||
| 2017 | -22 | -61 | -114 | -21 | -22 | -43 | -77 | -104 | -64 | -71 | ||
| 2018 | -89 | -92 | -165 | -88 | -158 | -173 | -133 | -99 | -95 | -127 | -43 | -23 |
| 2019 | -122 | -101 | -67 | -97 | -205 | -154 | -127 | -91 | -139 | -128 | -169 | -137 |
| 2020 | -83 | -138 | -203 | -92 | -90 | -117 | -230 | -183 | -192 | -142 | -74 | -120 |
| 2021 | -70 | -80 | -75 | -138 | -188 | -47 | -115 | -108 | -122 | -151 | -79 | -194 |
| 2022 | -234 | -174 | -141 | -160 | -246 | -216 | -234 | -144 | -100 | -186 | -125 | -153 |
| 2023 | -157 | -108 | -138 | -131 | -160 | -175 | -225 | -269 | -229 | -145 | -179 | -203 |
| 2024 | -58 | |||||||||||
| - = No Data Reported; -- = Not Applicable; NA = Not Available; W = Withheld to avoid disclosure of individual company data. |
| Release Date: 3/29/2024 |
| Next Release Date: 4/30/2024 |