|
Download Data (XLS File) |
|
||||||||
|
||||||||
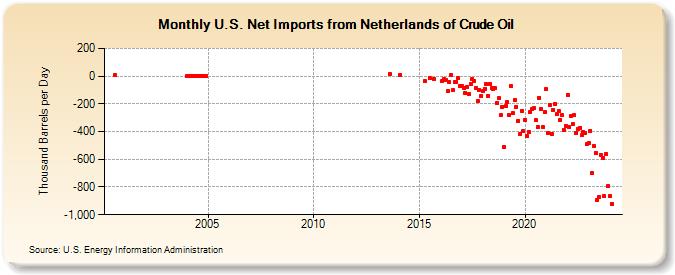
| U.S. Net Imports from Netherlands of Crude Oil (Thousand Barrels per Day) | ||||||||
| Year | Jan | Feb | Mar | Apr | May | Jun | Jul | Aug | Sep | Oct | Nov | Dec |
|---|---|---|---|---|---|---|---|---|---|---|---|---|
| 2000 | 8 | |||||||||||
| 2004 | 0 | 0 | 0 | 0 | 0 | 0 | 0 | 0 | 0 | 0 | 0 | 0 |
| 2013 | 16 | |||||||||||
| 2014 | 9 | |||||||||||
| 2015 | -37 | -14 | -21 | |||||||||
| 2016 | -36 | -20 | -29 | -110 | -44 | 10 | -101 | -46 | -42 | -16 | -71 | |
| 2017 | -72 | -85 | -123 | -78 | -126 | -59 | -23 | -33 | -83 | -181 | -97 | -144 |
| 2018 | -107 | -93 | -57 | -145 | -55 | -87 | -93 | -89 | -193 | -160 | -282 | -221 |
| 2019 | -512 | -219 | -186 | -283 | -73 | -269 | -173 | -222 | -321 | -421 | -249 | -398 |
| 2020 | -314 | -432 | -401 | -256 | -234 | -232 | -318 | -366 | -156 | -236 | -369 | -258 |
| 2021 | -96 | -411 | -208 | -416 | -241 | -199 | -275 | -255 | -315 | -284 | -387 | -358 |
| 2022 | -136 | -365 | -286 | -346 | -281 | -412 | -383 | -372 | -427 | -403 | -412 | -490 |
| 2023 | -481 | -393 | -698 | -506 | -552 | -893 | -873 | -572 | -590 | -865 | -562 | -795 |
| 2024 | -868 | -922 | ||||||||||
| - = No Data Reported; -- = Not Applicable; NA = Not Available; W = Withheld to avoid disclosure of individual company data. |
| Release Date: 4/30/2024 |
| Next Release Date: 5/31/2024 |