|
Download Data (XLS File) |
|
||||||||
|
||||||||
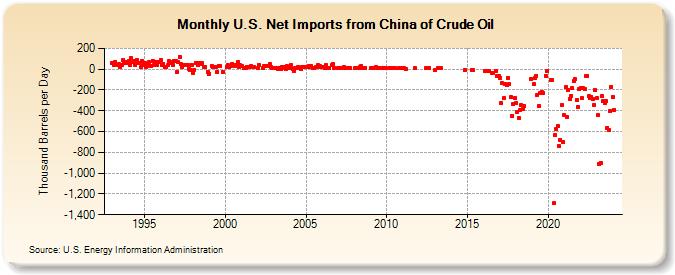
| U.S. Net Imports from China of Crude Oil (Thousand Barrels per Day) | ||||||||
| Year | Jan | Feb | Mar | Apr | May | Jun | Jul | Aug | Sep | Oct | Nov | Dec |
|---|---|---|---|---|---|---|---|---|---|---|---|---|
| 1993 | 60 | 44 | 73 | 40 | 46 | 24 | 38 | 89 | 61 | 68 | 61 | |
| 1994 | 78 | 44 | 104 | 67 | 80 | 36 | 92 | 64 | 63 | 18 | 79 | 40 |
| 1995 | 62 | 21 | 54 | 65 | 35 | 26 | 80 | 40 | 73 | 40 | 66 | 73 |
| 1996 | 86 | 42 | 53 | 18 | 19 | 37 | 78 | 73 | 64 | 36 | 78 | 78 |
| 1997 | -25 | 65 | 120 | 46 | 21 | 44 | 42 | 43 | 6 | -5 | 45 | |
| 1998 | -40 | -5 | 63 | 62 | 44 | 56 | 49 | 57 | 20 | 24 | -26 | |
| 1999 | -42 | 30 | 21 | 19 | -23 | 33 | 34 | -25 | ||||
| 2000 | 21 | 37 | 18 | 28 | 54 | 39 | 32 | 40 | 69 | 20 | 39 | |
| 2001 | 33 | 14 | 14 | 21 | 20 | 28 | 21 | |||||
| 2002 | 12 | 42 | 15 | 34 | 32 | 34 | 48 | 21 | 13 | |||
| 2003 | 16 | 14 | 7 | 6 | 7 | 6 | 25 | 13 | 24 | 5 | 28 | |
| 2004 | 7 | 38 | 6 | -20 | 7 | 7 | 21 | 7 | 6 | 24 | 23 | 22 |
| 2005 | 22 | 23 | 27 | 21 | 30 | 14 | 9 | 18 | 23 | 37 | 26 | 23 |
| 2006 | 23 | 21 | 16 | 40 | 7 | 16 | 40 | 49 | 15 | |||
| 2007 | 8 | 9 | 16 | 18 | 7 | 7 | 7 | 7 | ||||
| 2008 | 8 | 9 | 12 | 8 | 23 | 30 | 16 | 16 | 15 | |||
| 2009 | 8 | 8 | 20 | 16 | 8 | 8 | 8 | 8 | 8 | |||
| 2010 | 8 | 8 | 8 | 8 | 8 | 8 | ||||||
| 2011 | 11 | 2 | 8 | |||||||||
| 2012 | 8 | 7 | ||||||||||
| 2013 | -9 | 8 | 8 | |||||||||
| 2014 | -10 | |||||||||||
| 2015 | -7 | -7 | ||||||||||
| 2016 | -17 | -17 | -16 | -32 | -32 | -17 | -67 | -63 | ||||
| 2017 | -82 | -325 | -134 | -280 | -141 | -153 | -81 | -145 | -268 | -447 | -333 | -281 |
| 2018 | -330 | -412 | -469 | -395 | -345 | -385 | -352 | -95 | ||||
| 2019 | -144 | -82 | -62 | -250 | -355 | -229 | -221 | -227 | -62 | -17 | ||
| 2020 | -107 | -106 | -1,292 | -636 | -578 | -548 | -741 | -679 | -345 | -705 | ||
| 2021 | -445 | -172 | -463 | -202 | -285 | -255 | -184 | -113 | -98 | -292 | -361 | -188 |
| 2022 | -180 | -281 | -184 | -195 | -68 | -63 | -261 | -282 | -265 | -286 | -341 | -201 |
| 2023 | -276 | -505 | -752 | -1,047 | -263 | -304 | -361 | -309 | -562 | -568 | -404 | -173 |
| 2024 | -269 | -390 | -263 | -297 | -226 | -256 | ||||||
| - = No Data Reported; -- = Not Applicable; NA = Not Available; W = Withheld to avoid disclosure of individual company data. |
| Release Date: 8/30/2024 |
| Next Release Date: 9/30/2024 |