|
Download Data (XLS File) |
|
||||||||
|
||||||||
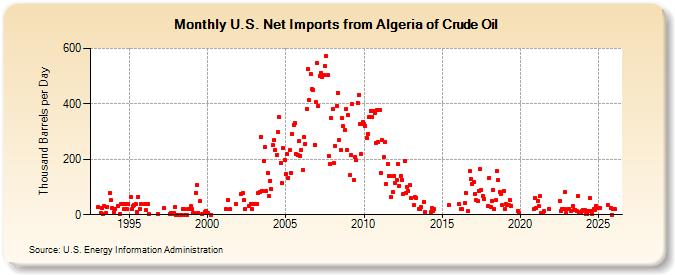
| U.S. Net Imports from Algeria of Crude Oil (Thousand Barrels per Day) | ||||||||
| Year | Jan | Feb | Mar | Apr | May | Jun | Jul | Aug | Sep | Oct | Nov | Dec |
|---|---|---|---|---|---|---|---|---|---|---|---|---|
| 1993 | 28 | 7 | 26 | 3 | 32 | 6 | 28 | 80 | 52 | 25 | ||
| 1994 | 8 | 20 | 30 | 2 | 38 | 39 | 20 | 38 | 20 | 39 | ||
| 1995 | 64 | 19 | 31 | 36 | 39 | 11 | 65 | 20 | 39 | |||
| 1996 | 38 | 16 | 38 | 2 | 3 | |||||||
| 1997 | 23 | 4 | 6 | 3 | 7 | 28 | ||||||
| 1998 | 0 | 0 | 0 | 0 | 21 | 20 | 0 | 0 | 21 | 22 | 31 | |
| 1999 | 20 | 6 | 6 | 80 | 107 | 7 | 48 | 4 | 11 | 15 | ||
| 2000 | 7 | 0 | ||||||||||
| 2001 | 19 | 54 | 20 | 37 | ||||||||
| 2002 | 75 | 77 | 53 | 19 | 32 | 40 | 21 | 40 | ||||
| 2003 | 39 | 40 | 77 | 81 | 282 | 86 | 192 | 243 | 86 | 151 | 69 | |
| 2004 | 123 | 92 | 253 | 268 | 234 | 216 | 297 | 352 | 187 | 114 | 240 | 199 |
| 2005 | 146 | 219 | 134 | 232 | 152 | 292 | 325 | 330 | 218 | 216 | 265 | 212 |
| 2006 | 235 | 163 | 281 | 256 | 381 | 524 | 413 | 506 | 453 | 449 | 253 | 406 |
| 2007 | 548 | 392 | 501 | 513 | 496 | 504 | 537 | 572 | 503 | 213 | 184 | 348 |
| 2008 | 381 | 187 | 247 | 393 | 440 | 269 | 232 | 348 | 319 | 305 | 381 | 235 |
| 2009 | 359 | 143 | 215 | 398 | 126 | 207 | 196 | 404 | 433 | 327 | 219 | 336 |
| 2010 | 327 | 320 | 276 | 292 | 352 | 375 | 353 | 374 | 366 | 259 | 379 | 262 |
| 2011 | 378 | 150 | 268 | 207 | 263 | 110 | 184 | 140 | 139 | 64 | 82 | 141 |
| 2012 | 113 | 126 | 184 | 104 | 140 | 127 | 76 | 192 | 79 | 100 | 85 | 107 |
| 2013 | 60 | 34 | 65 | 61 | 20 | 20 | 27 | 47 | 9 | |||
| 2014 | 8 | 26 | 15 | 19 | ||||||||
| 2015 | 35 | |||||||||||
| 2016 | 37 | 19 | 20 | 42 | 79 | 12 | 156 | 129 | 112 | |||
| 2017 | 118 | 75 | 52 | 48 | 87 | 165 | 89 | 68 | 56 | 31 | ||
| 2018 | 133 | 29 | 51 | 90 | 20 | 53 | 158 | 125 | 83 | 76 | 34 | 87 |
| 2019 | 21 | 37 | 34 | 35 | 53 | 33 | 15 | 5 | ||||
| 2020 | 19 | 61 | ||||||||||
| 2021 | 24 | 50 | 30 | 68 | 7 | 7 | 12 | 21 | ||||
| 2022 | 51 | 12 | 21 | 21 | 81 | 5 | ||||||
| 2023 | 20 | 22 | 12 | 30 | 17 | 18 | 13 | 67 | 6 | 8 | 12 | |
| 2024 | 17 | |||||||||||
| - = No Data Reported; -- = Not Applicable; NA = Not Available; W = Withheld to avoid disclosure of individual company data. |
| Release Date: 3/29/2024 |
| Next Release Date: 4/30/2024 |