|
Download Data (XLS File) |
|
||||||||
|
||||||||
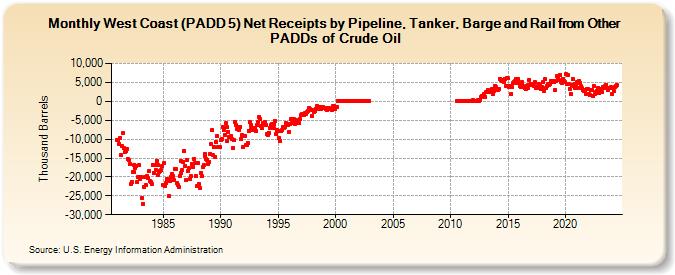
| West Coast (PADD 5) Net Receipts by Pipeline, Tanker, Barge and Rail from Other PADDs of Crude Oil (Thousand Barrels) | ||||||||
| Year | Jan | Feb | Mar | Apr | May | Jun | Jul | Aug | Sep | Oct | Nov | Dec |
|---|---|---|---|---|---|---|---|---|---|---|---|---|
| 1981 | -10,342 | -10,315 | -11,265 | -9,676 | -14,255 | -11,931 | -8,510 | -12,473 | -13,289 | -13,209 | -12,515 | -15,218 |
| 1982 | -15,548 | -16,564 | -21,950 | -21,377 | -18,692 | -18,774 | -16,761 | -17,576 | -17,200 | -21,423 | -19,902 | -16,821 |
| 1983 | -20,428 | -19,998 | -25,564 | -27,152 | -22,562 | -20,137 | -22,184 | -19,641 | -20,371 | -18,439 | -20,956 | -21,368 |
| 1984 | -21,898 | -16,758 | -18,860 | -16,825 | -18,178 | -15,691 | -19,502 | -16,796 | -18,757 | -18,331 | -18,299 | -17,026 |
| 1985 | -22,155 | -16,213 | -22,307 | -21,620 | -20,447 | -20,787 | -25,112 | -21,198 | -19,950 | -19,190 | -19,807 | -20,885 |
| 1986 | -17,879 | -17,968 | -21,613 | -22,152 | -22,611 | -19,784 | -18,987 | -15,894 | -18,200 | -16,076 | -13,199 | -17,125 |
| 1987 | -20,923 | -15,439 | -18,373 | -17,660 | -20,546 | -19,865 | -16,567 | -17,355 | -15,255 | -16,443 | -19,819 | -22,472 |
| 1988 | -16,246 | -21,982 | -22,825 | -18,906 | -19,884 | -17,411 | -16,829 | -13,887 | -14,429 | -15,233 | -15,526 | -16,557 |
| 1989 | -15,968 | -13,810 | -11,359 | -7,657 | -14,297 | -12,126 | -14,662 | -10,762 | -9,094 | -12,208 | -11,975 | -12,161 |
| 1990 | -10,215 | -9,978 | -6,784 | -7,685 | -8,813 | -5,817 | -6,717 | -10,537 | -8,108 | -9,392 | -9,361 | -9,163 |
| 1991 | -10,015 | -12,417 | -10,217 | -5,454 | -6,263 | -7,220 | -6,780 | -7,702 | -6,731 | -10,066 | -8,894 | -12,155 |
| 1992 | -9,196 | -9,161 | -11,572 | -11,559 | -11,027 | -7,741 | -5,521 | -6,238 | -7,439 | -6,980 | -7,573 | -7,124 |
| 1993 | -6,988 | -7,735 | -6,305 | -5,510 | -4,025 | -4,588 | -6,419 | -7,033 | -5,629 | -5,931 | -5,394 | -6,190 |
| 1994 | -8,774 | -8,841 | -8,279 | -6,952 | -6,282 | -6,119 | -6,646 | -7,030 | -5,953 | -5,239 | -8,783 | -7,632 |
| 1995 | -7,891 | -9,623 | -10,427 | -7,956 | -7,562 | -6,852 | -7,184 | -6,810 | -5,738 | -5,990 | -6,243 | -8,027 |
| 1996 | -6,062 | -4,720 | -5,778 | -4,984 | -4,790 | -5,932 | -4,886 | -5,695 | -5,819 | -5,804 | -5,714 | -4,782 |
| 1997 | -3,675 | -3,244 | -3,470 | -3,680 | -3,177 | -3,425 | -2,779 | -2,481 | -1,667 | -1,926 | -2,179 | -3,832 |
| 1998 | -2,251 | -2,724 | -2,512 | -1,917 | -1,284 | -1,943 | -1,729 | -1,408 | -1,404 | -1,968 | -1,571 | -1,577 |
| 1999 | -1,727 | -1,777 | -1,988 | -2,381 | -1,687 | -1,851 | -2,029 | -2,119 | -2,343 | -1,369 | -1,271 | -1,919 |
| 2000 | -1,525 | -1,422 | 0 | 0 | 0 | 0 | 0 | 0 | 0 | 0 | 0 | 0 |
| 2001 | 0 | 0 | 0 | 0 | 0 | 0 | 0 | 0 | 0 | 0 | 0 | 0 |
| 2002 | 0 | 0 | 0 | 0 | 0 | 0 | 0 | 0 | 0 | 0 | 0 | 0 |
| 2010 | 25 | 166 | 25 | 180 | 87 | 27 | ||||||
| 2011 | 135 | 27 | 152 | 53 | 192 | 85 | 157 | 131 | 50 | 106 | 283 | |
| 2012 | 78 | 206 | 104 | 191 | 253 | 204 | 352 | 1,063 | 1,331 | 1,342 | 1,334 | 2,055 |
| 2013 | 1,243 | 2,442 | 2,458 | 2,952 | 2,564 | 2,358 | 2,370 | 3,264 | 1,937 | 2,832 | 4,114 | 3,703 |
| 2014 | 2,875 | 3,011 | 3,317 | 5,966 | 5,546 | 5,466 | 5,722 | 5,077 | 5,798 | 6,017 | 4,175 | 6,215 |
| 2015 | 6,038 | 3,905 | 3,936 | 1,980 | 3,706 | 4,882 | 5,114 | 5,291 | 5,825 | 4,715 | 5,924 | 4,846 |
| 2016 | 3,980 | 3,743 | 5,056 | 4,066 | 3,792 | 3,499 | 3,303 | 4,128 | 3,502 | 4,251 | 5,752 | 4,294 |
| 2017 | 4,597 | 4,607 | 4,479 | 4,071 | 4,975 | 3,495 | 3,501 | 3,926 | 4,448 | 4,300 | 3,371 | 3,833 |
| 2018 | 4,998 | 2,837 | 5,881 | 3,452 | 4,062 | 4,444 | 4,359 | 4,483 | 5,324 | 5,051 | 5,469 | 5,384 |
| 2019 | 4,989 | 3,097 | 5,430 | 6,579 | 6,282 | 5,598 | 6,890 | 5,138 | 4,906 | 5,972 | 5,236 | 5,009 |
| 2020 | 7,164 | 4,453 | 7,049 | 4,580 | 3,358 | 2,037 | 4,190 | 5,995 | 4,054 | 4,528 | 3,472 | 4,548 |
| 2021 | 5,082 | 3,463 | 5,432 | 4,733 | 3,934 | 3,420 | 2,864 | 2,803 | 3,089 | 1,899 | 3,156 | 3,289 |
| 2022 | 1,837 | 1,705 | 2,857 | 3,081 | 1,460 | 4,104 | 2,057 | 2,363 | 2,808 | 2,164 | 3,564 | 2,234 |
| 2023 | 3,215 | 3,238 | 2,473 | 3,775 | 3,472 | 3,932 | 4,386 | 3,591 | 2,916 | 3,426 | 3,579 | 3,681 |
| 2024 | 1,927 | |||||||||||
| - = No Data Reported; -- = Not Applicable; NA = Not Available; W = Withheld to avoid disclosure of individual company data. |
| Release Date: 3/29/2024 |
| Next Release Date: 4/30/2024 |