|
Download Data (XLS File) |
|
||||||||
|
||||||||
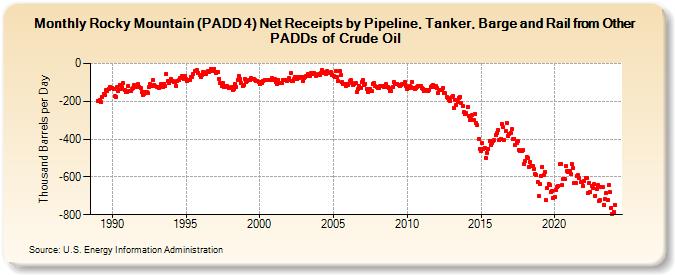
| Rocky Mountain (PADD 4) Net Receipts by Pipeline, Tanker, Barge and Rail from Other PADDs of Crude Oil (Thousand Barrels per Day) | ||||||||
| Year | Jan | Feb | Mar | Apr | May | Jun | Jul | Aug | Sep | Oct | Nov | Dec |
|---|---|---|---|---|---|---|---|---|---|---|---|---|
| 1989 | -197 | -201 | -193 | -204 | -176 | -160 | -169 | -142 | -147 | -133 | -127 | -128 |
| 1990 | -128 | -135 | -174 | -175 | -126 | -143 | -115 | -135 | -125 | -103 | -142 | -152 |
| 1991 | -153 | -119 | -143 | -143 | -133 | -130 | -114 | -119 | -123 | -111 | -123 | -130 |
| 1992 | -149 | -169 | -160 | -151 | -150 | -157 | -124 | -111 | -120 | -88 | -112 | -121 |
| 1993 | -123 | -126 | -131 | -125 | -111 | -127 | -108 | -121 | -55 | -94 | -104 | -95 |
| 1994 | -83 | -94 | -99 | -100 | -117 | -91 | -89 | -78 | -77 | -66 | -80 | -65 |
| 1995 | -80 | -93 | -85 | -87 | -70 | -72 | -54 | -41 | -42 | -37 | -48 | -61 |
| 1996 | -73 | -59 | -43 | -55 | -53 | -47 | -40 | -44 | -29 | -34 | -39 | -27 |
| 1997 | -48 | -45 | -46 | -80 | -105 | -117 | -102 | -126 | -119 | -120 | -126 | -131 |
| 1998 | -131 | -126 | -138 | -134 | -110 | -123 | -87 | -65 | -83 | -102 | -121 | -112 |
| 1999 | -83 | -99 | -95 | -87 | -87 | -77 | -84 | -81 | -85 | -92 | -93 | -99 |
| 2000 | -111 | -98 | -102 | -93 | -86 | -85 | -87 | -87 | -86 | -86 | -77 | -89 |
| 2001 | -83 | -98 | -109 | -85 | -101 | -104 | -105 | -88 | -87 | -90 | -95 | -88 |
| 2002 | -79 | -51 | -93 | -94 | -84 | -74 | -83 | -73 | -79 | -74 | -71 | -95 |
| 2003 | -78 | -71 | -66 | -58 | -64 | -66 | -49 | -54 | -50 | -54 | -64 | -63 |
| 2004 | -57 | -60 | -49 | -37 | -52 | -44 | -56 | -42 | -49 | -52 | -47 | -59 |
| 2005 | -66 | -73 | -40 | -72 | -94 | -39 | -63 | -97 | -111 | -107 | -119 | -106 |
| 2006 | -116 | -94 | -89 | -103 | -113 | -110 | -102 | -150 | -134 | -119 | -129 | -97 |
| 2007 | -89 | -114 | -108 | -134 | -150 | -146 | -137 | -145 | -107 | -104 | -121 | -126 |
| 2008 | -130 | -129 | -120 | -121 | -119 | -123 | -126 | -109 | -127 | -131 | -146 | -147 |
| 2009 | -123 | -98 | -109 | -106 | -107 | -113 | -117 | -114 | -110 | -110 | -99 | -121 |
| 2010 | -136 | -128 | -120 | -125 | -99 | -128 | -134 | -128 | -125 | -119 | -120 | -119 |
| 2011 | -130 | -135 | -143 | -142 | -141 | -146 | -138 | -122 | -120 | -113 | -125 | -120 |
| 2012 | -128 | -156 | -139 | -142 | -139 | -128 | -158 | -158 | -176 | -181 | -192 | -196 |
| 2013 | -178 | -171 | -234 | -191 | -220 | -206 | -182 | -175 | -210 | -226 | -259 | -268 |
| 2014 | -264 | -228 | -277 | -298 | -294 | -270 | -298 | -267 | -313 | -326 | -401 | -451 |
| 2015 | -464 | -422 | -451 | -446 | -498 | -471 | -452 | -409 | -432 | -418 | -408 | -407 |
| 2016 | -380 | -370 | -352 | -405 | -398 | -321 | -335 | -404 | -358 | -314 | -381 | -372 |
| 2017 | -369 | -348 | -401 | -398 | -430 | -419 | -411 | -457 | -464 | -464 | -459 | -530 |
| 2018 | -515 | -494 | -502 | -545 | -523 | -541 | -540 | -560 | -584 | -589 | -626 | -702 |
| 2019 | -638 | -594 | -545 | -588 | -575 | -721 | -660 | -639 | -645 | -682 | -672 | -710 |
| 2020 | -704 | -669 | -654 | -646 | -534 | -530 | -644 | -611 | -609 | -543 | -569 | -576 |
| 2021 | -569 | -586 | -534 | -555 | -633 | -632 | -596 | -592 | -608 | -629 | -629 | -649 |
| 2022 | -624 | -604 | -605 | -684 | -630 | -680 | -649 | -660 | -640 | -699 | -662 | -645 |
| 2023 | -727 | -724 | -651 | -651 | -746 | -719 | -684 | -724 | -642 | -680 | -763 | -797 |
| 2024 | -778 | |||||||||||
| - = No Data Reported; -- = Not Applicable; NA = Not Available; W = Withheld to avoid disclosure of individual company data. |
| Release Date: 3/29/2024 |
| Next Release Date: 4/30/2024 |