|
Download Data (XLS File) |
|
||||||||
|
||||||||
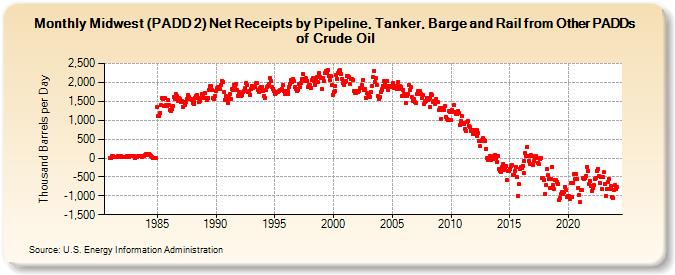
| Midwest (PADD 2) Net Receipts by Pipeline, Tanker, Barge and Rail from Other PADDs of Crude Oil (Thousand Barrels per Day) | ||||||||
| Year | Jan | Feb | Mar | Apr | May | Jun | Jul | Aug | Sep | Oct | Nov | Dec |
|---|---|---|---|---|---|---|---|---|---|---|---|---|
| 1981 | 13 | 13 | 44 | 43 | 31 | 36 | 36 | 34 | 42 | 37 | 35 | 40 |
| 1982 | 35 | 35 | 32 | 38 | 35 | 49 | 59 | 39 | 43 | 40 | 52 | 42 |
| 1983 | 50 | -9 | 34 | 25 | 42 | 55 | 62 | 54 | 38 | 58 | 66 | 76 |
| 1984 | 99 | 81 | 108 | 94 | 112 | 77 | 55 | 32 | 1 | -4 | -2 | |
| 1985 | 1,362 | 1,118 | 1,123 | 1,199 | 1,390 | 1,578 | 1,563 | 1,370 | 1,593 | 1,390 | 1,380 | 1,531 |
| 1986 | 1,390 | 1,259 | 1,239 | 1,283 | 1,380 | 1,602 | 1,548 | 1,705 | 1,640 | 1,501 | 1,580 | 1,567 |
| 1987 | 1,470 | 1,509 | 1,362 | 1,485 | 1,404 | 1,487 | 1,572 | 1,657 | 1,619 | 1,551 | 1,563 | 1,542 |
| 1988 | 1,462 | 1,439 | 1,487 | 1,598 | 1,631 | 1,665 | 1,574 | 1,491 | 1,503 | 1,593 | 1,688 | 1,622 |
| 1989 | 1,583 | 1,712 | 1,575 | 1,533 | 1,594 | 1,809 | 1,894 | 1,895 | 1,797 | 1,579 | 1,572 | 1,652 |
| 1990 | 1,761 | 1,840 | 1,874 | 1,867 | 1,828 | 1,935 | 2,036 | 2,005 | 1,734 | 1,545 | 1,636 | 1,557 |
| 1991 | 1,443 | 1,591 | 1,683 | 1,567 | 1,835 | 1,809 | 1,941 | 1,892 | 1,964 | 1,809 | 1,651 | 1,737 |
| 1992 | 1,709 | 1,708 | 1,649 | 1,659 | 1,757 | 1,784 | 1,848 | 1,988 | 1,936 | 1,743 | 1,769 | 1,674 |
| 1993 | 1,821 | 1,901 | 1,858 | 1,866 | 1,882 | 1,982 | 1,973 | 1,801 | 1,737 | 1,840 | 1,880 | 1,876 |
| 1994 | 1,763 | 1,653 | 1,585 | 1,794 | 1,889 | 1,911 | 1,958 | 2,115 | 2,032 | 1,874 | 1,833 | 1,776 |
| 1995 | 1,693 | 1,716 | 1,758 | 1,748 | 1,768 | 1,788 | 1,791 | 1,835 | 1,935 | 1,769 | 1,706 | 1,699 |
| 1996 | 1,765 | 1,688 | 1,778 | 1,878 | 1,952 | 2,074 | 2,017 | 2,093 | 2,028 | 1,872 | 1,835 | 1,773 |
| 1997 | 1,806 | 1,964 | 1,888 | 1,984 | 2,092 | 2,234 | 2,087 | 2,046 | 2,106 | 2,047 | 1,878 | 1,928 |
| 1998 | 1,935 | 1,857 | 2,071 | 2,111 | 2,030 | 1,937 | 2,060 | 2,146 | 2,000 | 2,238 | 2,155 | 2,126 |
| 1999 | 1,833 | 2,119 | 2,033 | 2,247 | 2,288 | 2,242 | 2,318 | 2,157 | 2,067 | 2,173 | 1,922 | 1,678 |
| 2000 | 1,757 | 1,778 | 1,900 | 2,183 | 2,095 | 2,250 | 2,310 | 2,315 | 2,222 | 2,097 | 1,991 | 1,919 |
| 2001 | 2,022 | 2,047 | 2,164 | 2,171 | 2,142 | 1,947 | 2,097 | 2,088 | 2,076 | 1,771 | 1,730 | 1,731 |
| 2002 | 1,781 | 1,736 | 1,777 | 1,839 | 1,847 | 1,933 | 2,075 | 1,795 | 1,827 | 1,595 | 1,732 | 1,687 |
| 2003 | 1,655 | 1,620 | 1,743 | 1,912 | 2,139 | 2,302 | 2,016 | 2,116 | 1,937 | 1,643 | 1,565 | 1,615 |
| 2004 | 1,740 | 1,791 | 1,829 | 1,913 | 2,034 | 1,955 | 1,883 | 2,046 | 1,786 | 1,906 | 1,907 | 1,897 |
| 2005 | 1,884 | 1,982 | 1,861 | 1,910 | 1,913 | 1,824 | 2,014 | 1,828 | 1,893 | 1,891 | 1,643 | 1,800 |
| 2006 | 1,693 | 1,634 | 1,461 | 1,647 | 1,702 | 1,921 | 1,800 | 1,874 | 1,610 | 1,518 | 1,566 | 1,484 |
| 2007 | 1,451 | 1,692 | 1,765 | 1,695 | 1,759 | 1,705 | 1,579 | 1,666 | 1,425 | 1,477 | 1,502 | 1,594 |
| 2008 | 1,528 | 1,572 | 1,358 | 1,600 | 1,700 | 1,654 | 1,492 | 1,504 | 1,438 | 1,568 | 1,486 | 1,481 |
| 2009 | 1,280 | 1,313 | 1,041 | 1,273 | 1,332 | 1,259 | 1,375 | 1,092 | 1,041 | 1,018 | 1,234 | 1,214 |
| 2010 | 1,006 | 1,277 | 1,212 | 1,393 | 1,216 | 1,169 | 1,167 | 1,256 | 1,187 | 862 | 970 | 1,103 |
| 2011 | 934 | 898 | 779 | 713 | 940 | 968 | 857 | 831 | 724 | 739 | 641 | 737 |
| 2012 | 647 | 664 | 591 | 733 | 660 | 445 | 307 | 445 | 463 | 520 | 474 | 456 |
| 2013 | 246 | 9 | -47 | -50 | 52 | -44 | -38 | -38 | 58 | 84 | 10 | -107 |
| 2014 | 55 | -295 | -346 | -373 | -247 | -169 | -320 | -286 | -207 | -570 | -345 | -351 |
| 2015 | -283 | -216 | -188 | -448 | -442 | -353 | -228 | -498 | -992 | -697 | -283 | -239 |
| 2016 | -255 | -204 | -387 | -80 | 133 | 61 | 304 | 45 | -73 | -155 | 69 | 49 |
| 2017 | -183 | -90 | 11 | 56 | 2 | -130 | -169 | -25 | -13 | -527 | -540 | -584 |
| 2018 | -948 | -715 | -291 | -460 | -543 | -798 | -549 | -228 | -710 | -810 | -584 | -582 |
| 2019 | -646 | -699 | -1,116 | -1,065 | -956 | -911 | -956 | -886 | -755 | -857 | -1,035 | -1,014 |
| 2020 | -1,002 | -1,084 | -1,044 | -652 | -1,026 | -661 | -434 | -558 | -424 | -559 | -781 | -983 |
| 2021 | -1,176 | -857 | -857 | -533 | -556 | -529 | -472 | -231 | -346 | -688 | -618 | -737 |
| 2022 | -884 | -789 | -724 | -554 | -539 | -332 | -284 | -478 | -652 | -510 | -818 | -513 |
| 2023 | -366 | -682 | -1,005 | -833 | -647 | -559 | -821 | -750 | -1,025 | -1,068 | -838 | -724 |
| 2024 | -824 | |||||||||||
| - = No Data Reported; -- = Not Applicable; NA = Not Available; W = Withheld to avoid disclosure of individual company data. |
| Release Date: 3/29/2024 |
| Next Release Date: 4/30/2024 |
Referring Pages: