|
Download Data (XLS File) |
|
||||||||
|
||||||||
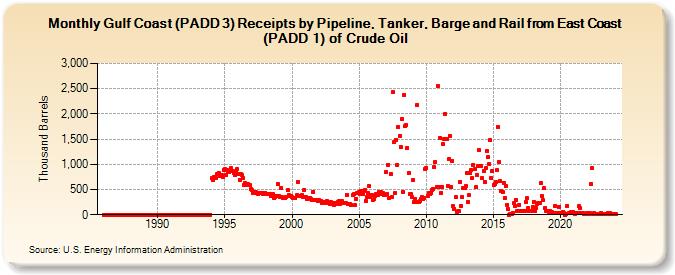
| Gulf Coast (PADD 3) Receipts by Pipeline, Tanker, Barge and Rail from East Coast (PADD 1) of Crude Oil (Thousand Barrels) | ||||||||
| Year | Jan | Feb | Mar | Apr | May | Jun | Jul | Aug | Sep | Oct | Nov | Dec |
|---|---|---|---|---|---|---|---|---|---|---|---|---|
| 1986 | 0 | 0 | 0 | 0 | 0 | 0 | 0 | 0 | 0 | 0 | 0 | 0 |
| 1987 | 0 | 0 | 0 | 0 | 0 | 0 | 0 | 0 | 0 | 0 | 0 | 0 |
| 1988 | 0 | 0 | 0 | 0 | 0 | 0 | 0 | 0 | 0 | 0 | 0 | 0 |
| 1989 | 0 | 0 | 0 | 0 | 0 | 0 | 0 | 0 | 0 | 0 | 0 | 0 |
| 1990 | 0 | 0 | 0 | 0 | 0 | 0 | 0 | 0 | 0 | 0 | 0 | 0 |
| 1991 | 0 | 0 | 0 | 0 | 0 | 0 | 0 | 0 | 0 | 0 | 0 | 0 |
| 1992 | 0 | 0 | 0 | 0 | 0 | 0 | 0 | 0 | 0 | 0 | 0 | 0 |
| 1993 | 0 | 0 | 0 | 0 | 0 | 0 | 0 | 0 | 0 | 0 | 0 | 0 |
| 1994 | 722 | 685 | 744 | 741 | 723 | 802 | 812 | 818 | 770 | 795 | 752 | 896 |
| 1995 | 904 | 795 | 887 | 849 | 857 | 918 | 875 | 862 | 826 | 785 | 856 | 901 |
| 1996 | 812 | 692 | 812 | 794 | 722 | 592 | 622 | 601 | 588 | 611 | 589 | 509 |
| 1997 | 486 | 438 | 457 | 438 | 441 | 432 | 408 | 435 | 434 | 434 | 420 | 433 |
| 1998 | 433 | 401 | 419 | 411 | 413 | 367 | 382 | 404 | 325 | 349 | 370 | 616 |
| 1999 | 380 | 352 | 529 | 346 | 329 | 324 | 324 | 361 | 481 | 391 | 378 | 378 |
| 2000 | 348 | 330 | 332 | 330 | 385 | 654 | 366 | 370 | 362 | 386 | 346 | 497 |
| 2001 | 344 | 307 | 333 | 327 | 332 | 313 | 298 | 460 | 292 | 290 | 287 | 280 |
| 2002 | 295 | 267 | 281 | 235 | 246 | 260 | 238 | 263 | 249 | 258 | 205 | 246 |
| 2003 | 237 | 200 | 241 | 207 | 222 | 262 | 264 | 218 | 245 | 266 | 230 | 239 |
| 2004 | 235 | 399 | 208 | 212 | 213 | 196 | 383 | 404 | 183 | 318 | 431 | 438 |
| 2005 | 450 | 415 | 469 | 418 | 472 | 492 | 278 | 348 | 421 | 567 | 358 | 393 |
| 2006 | 297 | 304 | 369 | 417 | 420 | 395 | 445 | 456 | 413 | 425 | 384 | 387 |
| 2007 | 851 | 414 | 995 | 337 | 811 | 360 | 2,431 | 1,436 | 427 | 1,492 | 993 | 1,735 |
| 2008 | 1,567 | 1,347 | 1,895 | 460 | 2,384 | 1,753 | 1,781 | 1,324 | 826 | 410 | 408 | 342 |
| 2009 | 692 | 250 | 309 | 261 | 2,180 | 254 | 265 | 310 | 345 | 308 | 338 | 904 |
| 2010 | 932 | 377 | 428 | 406 | 440 | 491 | 514 | 939 | 1,044 | 554 | 2,562 | 555 |
| 2011 | 1,525 | 433 | 552 | 1,394 | 1,506 | 2,007 | 1,509 | 570 | 1,101 | 1,568 | 547 | 1,067 |
| 2012 | 175 | 120 | 350 | 63 | 66 | 65 | 657 | 169 | 350 | 521 | 524 | 564 |
| 2013 | 826 | 249 | 383 | 836 | 878 | 724 | 995 | 905 | 540 | 787 | 960 | 1,286 |
| 2014 | 970 | 970 | 722 | 870 | 653 | 930 | 1,269 | 1,139 | 999 | 1,487 | 727 | 871 |
| 2015 | 590 | 616 | 652 | 882 | 1,746 | 1,047 | 660 | 466 | 445 | 634 | 339 | 562 |
| 2016 | 201 | 104 | 0 | 18 | 21 | 38 | 223 | 173 | 299 | 73 | 73 | 198 |
| 2017 | 73 | 73 | 73 | 74 | 74 | 249 | 326 | 127 | 74 | 74 | 73 | 152 |
| 2018 | 256 | 75 | 129 | 208 | 229 | 232 | 623 | 362 | 285 | 522 | 137 | 74 |
| 2019 | 73 | 56 | 64 | 47 | 44 | 28 | 37 | 178 | 27 | 40 | 162 | 40 |
| 2020 | 37 | 30 | 58 | 33 | 0 | 8 | 176 | 26 | 33 | 46 | 40 | 48 |
| 2021 | 41 | 19 | 39 | 29 | 169 | 126 | 35 | 35 | 31 | 17 | 24 | 31 |
| 2022 | 36 | 21 | 25 | 614 | 920 | 20 | 25 | 23 | 15 | 20 | 21 | 20 |
| 2023 | 30 | 17 | 18 | 12 | 20 | 12 | 42 | 20 | 26 | 20 | 13 | 16 |
| 2024 | 14 | |||||||||||
| - = No Data Reported; -- = Not Applicable; NA = Not Available; W = Withheld to avoid disclosure of individual company data. |
| Release Date: 3/29/2024 |
| Next Release Date: 4/30/2024 |