|
Download Data (XLS File) |
|
||||||||
|
||||||||
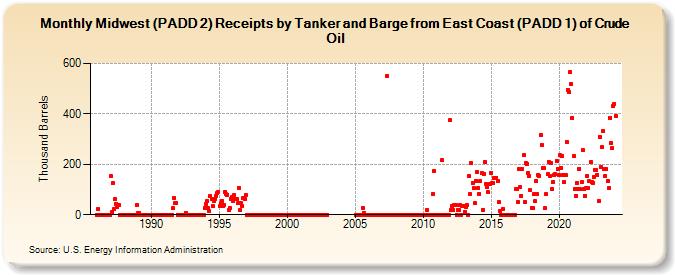
| Midwest (PADD 2) Receipts by Tanker and Barge from East Coast (PADD 1) of Crude Oil (Thousand Barrels) | ||||||||
| Year | Jan | Feb | Mar | Apr | May | Jun | Jul | Aug | Sep | Oct | Nov | Dec |
|---|---|---|---|---|---|---|---|---|---|---|---|---|
| 1986 | 0 | 23 | 0 | 0 | 0 | 0 | 0 | 0 | 0 | 0 | 0 | 0 |
| 1987 | 152 | 10 | 125 | 21 | 61 | 44 | 31 | 39 | 0 | 0 | 0 | 0 |
| 1988 | 0 | 0 | 0 | 0 | 0 | 0 | 0 | 0 | 0 | 0 | 0 | 38 |
| 1989 | 7 | 6 | 0 | 0 | 0 | 0 | 0 | 0 | 0 | 0 | 0 | 0 |
| 1990 | 0 | 0 | 0 | 0 | 0 | 0 | 0 | 0 | 0 | 0 | 0 | 0 |
| 1991 | 0 | 0 | 0 | 0 | 0 | 0 | 0 | 25 | 68 | 47 | 46 | 0 |
| 1992 | 0 | 0 | 0 | 0 | 0 | 0 | 8 | 0 | 0 | 0 | 0 | 0 |
| 1993 | 0 | 0 | 0 | 0 | 0 | 0 | 0 | 0 | 0 | 0 | 0 | 25 |
| 1994 | 44 | 54 | 27 | 13 | 74 | 61 | 36 | 55 | 63 | 75 | 85 | 91 |
| 1995 | 35 | 45 | 56 | 36 | 37 | 92 | 82 | 80 | 19 | 26 | 63 | 70 |
| 1996 | 53 | 78 | 62 | 61 | 45 | 106 | 18 | 46 | 35 | 67 | 63 | 79 |
| 1997 | 0 | 0 | 0 | 0 | 0 | 0 | 0 | 0 | 0 | 0 | 0 | 0 |
| 1998 | 0 | 0 | 0 | 0 | 0 | 0 | 0 | 0 | 0 | 0 | 0 | 0 |
| 1999 | 0 | 0 | 0 | 0 | 0 | 0 | 0 | 0 | 0 | 0 | 0 | 0 |
| 2000 | 0 | 0 | 0 | 0 | 0 | 0 | 0 | 0 | 0 | 0 | 0 | 0 |
| 2001 | 0 | 0 | 0 | 0 | 0 | 0 | 0 | 0 | 0 | 0 | 0 | 0 |
| 2002 | 0 | 0 | 0 | 0 | 0 | 0 | 0 | 0 | 0 | 0 | 0 | 0 |
| 2005 | 0 | 0 | 0 | 0 | 0 | 0 | 28 | 7 | 0 | 0 | 0 | 0 |
| 2006 | 0 | 0 | 0 | 0 | 0 | 0 | 0 | 0 | 0 | 0 | 0 | 0 |
| 2007 | 0 | 0 | 0 | 0 | 550 | 0 | 0 | 0 | 0 | 0 | 0 | 0 |
| 2008 | 0 | 0 | 0 | 0 | 0 | 0 | 0 | 0 | 0 | 0 | 0 | 0 |
| 2009 | 0 | 0 | 0 | 0 | 0 | 0 | 0 | 0 | 0 | 0 | 0 | 0 |
| 2010 | 0 | 0 | 0 | 17 | 0 | 0 | 0 | 0 | 83 | 174 | 0 | 0 |
| 2011 | 0 | 0 | 0 | 0 | 216 | 0 | 0 | 0 | 0 | 0 | 0 | 374 |
| 2012 | 18 | 35 | 18 | 37 | 37 | 0 | 20 | 19 | 38 | 0 | 36 | 36 |
| 2013 | 12 | 32 | 38 | 0 | 152 | 82 | 204 | 126 | 105 | 46 | 134 | 169 |
| 2014 | 106 | 83 | 133 | 166 | 20 | 163 | 211 | 123 | 108 | 89 | 123 | 167 |
| 2015 | 124 | 125 | 147 | 144 | 147 | 132 | 50 | 14 | 0 | 0 | 23 | 0 |
| 2016 | 0 | 0 | 0 | 0 | 0 | 0 | 0 | 0 | 0 | 102 | 104 | 51 |
| 2017 | 181 | 108 | 76 | 182 | 236 | 50 | 206 | 201 | 165 | 155 | 97 | 27 |
| 2018 | 27 | 81 | 53 | 133 | 81 | 158 | 155 | 316 | 277 | 184 | 184 | 26 |
| 2019 | 81 | 161 | 211 | 154 | 206 | 104 | 130 | 158 | 161 | 215 | 182 | 158 |
| 2020 | 235 | 186 | 233 | 159 | 130 | 156 | 290 | 496 | 486 | 567 | 518 | 385 |
| 2021 | 231 | 103 | 76 | 126 | 101 | 183 | 101 | 128 | 256 | 103 | 76 | 105 |
| 2022 | 155 | 105 | 132 | 208 | 129 | 126 | 150 | 178 | 178 | 157 | 54 | 310 |
| 2023 | 190 | 268 | 332 | 180 | 153 | 181 | 133 | 105 | 385 | 286 | 264 | 432 |
| 2024 | 440 | |||||||||||
| - = No Data Reported; -- = Not Applicable; NA = Not Available; W = Withheld to avoid disclosure of individual company data. |
| Release Date: 3/29/2024 |
| Next Release Date: 4/30/2024 |