|
Download Data (XLS File) |
|
||||||||
|
||||||||
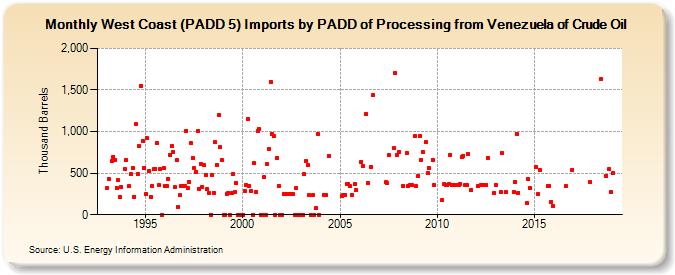
| West Coast (PADD 5) Imports by PADD of Processing from Venezuela of Crude Oil (Thousand Barrels) | ||||||||
| Year | Jan | Feb | Mar | Apr | May | Jun | Jul | Aug | Sep | Oct | Nov | Dec |
|---|---|---|---|---|---|---|---|---|---|---|---|---|
| 1993 | 317 | 435 | 640 | 700 | 652 | 325 | 412 | 215 | 335 | 546 | ||
| 1994 | 660 | 340 | 486 | 564 | 217 | 1,086 | 487 | 822 | 1,545 | 888 | 559 | |
| 1995 | 247 | 922 | 520 | 214 | 348 | 546 | 554 | 862 | 353 | 552 | 0 | 562 |
| 1996 | 349 | 347 | 432 | 714 | 829 | 756 | 328 | 656 | 96 | 232 | 349 | 351 |
| 1997 | 346 | 1,010 | 320 | 393 | 857 | 685 | 561 | 519 | 1,001 | 313 | 614 | 335 |
| 1998 | 594 | 479 | 305 | 259 | 0 | 473 | 265 | 873 | 596 | 1,202 | 813 | 652 |
| 1999 | 0 | 0 | 254 | 262 | 0 | 259 | 495 | 268 | 384 | 0 | 0 | 0 |
| 2000 | 0 | 284 | 357 | 1,149 | 346 | 289 | 0 | 621 | 272 | 1,008 | 1,033 | 0 |
| 2001 | 0 | 449 | 0 | 604 | 788 | 1,598 | 973 | 941 | 0 | 685 | 349 | 0 |
| 2002 | 0 | 248 | 251 | 252 | 244 | 250 | 250 | 249 | 0 | 321 | 0 | 0 |
| 2003 | 0 | 0 | 486 | 646 | 592 | 237 | 0 | 236 | 0 | 75 | 971 | 0 |
| 2004 | 243 | 240 | 711 | |||||||||
| 2005 | 220 | 242 | 239 | 369 | 367 | 344 | 238 | 370 | 300 | |||
| 2006 | 639 | 585 | 1,215 | 379 | 579 | 1,436 | ||||||
| 2007 | 389 | 376 | 714 | 803 | 1,703 | 721 | ||||||
| 2008 | 755 | 350 | 746 | 350 | 360 | 355 | 941 | 345 | ||||
| 2009 | 471 | 948 | 663 | 757 | 873 | 500 | 556 | 661 | 357 | |||
| 2010 | 178 | 368 | 360 | 360 | 367 | 723 | 356 | 360 | ||||
| 2011 | 360 | 355 | 375 | 688 | 710 | 356 | 362 | 726 | 296 | |||
| 2012 | 348 | 354 | 355 | 360 | 686 | 267 | ||||||
| 2013 | 361 | 269 | 742 | 279 | 275 | |||||||
| 2014 | 397 | 973 | 265 | 135 | 427 | 323 | ||||||
| 2015 | 570 | 249 | 539 | 347 | 345 | 157 | 105 | |||||
| 2016 | 346 | 538 | ||||||||||
| 2017 | 397 | |||||||||||
| 2018 | 1,631 | 471 | 549 | 268 | ||||||||
| 2019 | 497 | |||||||||||
| - = No Data Reported; -- = Not Applicable; NA = Not Available; W = Withheld to avoid disclosure of individual company data. |
| Release Date: 3/29/2024 |
| Next Release Date: 4/30/2024 |