|
Download Data (XLS File) |
|
||||||||
|
||||||||
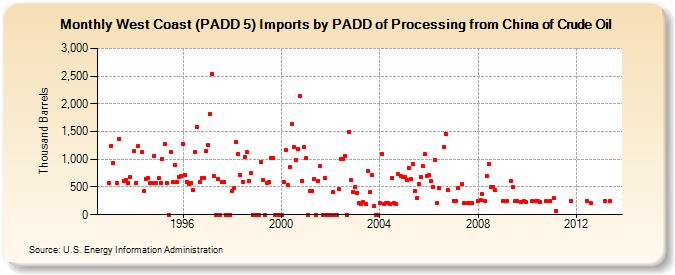
| West Coast (PADD 5) Imports by PADD of Processing from China of Crude Oil (Thousand Barrels) | ||||||||
| Year | Jan | Feb | Mar | Apr | May | Jun | Jul | Aug | Sep | Oct | Nov | Dec |
|---|---|---|---|---|---|---|---|---|---|---|---|---|
| 1993 | 564 | 1,245 | 936 | 567 | 1,366 | 603 | 629 | 568 | 683 | |||
| 1994 | 1,142 | 569 | 1,237 | 1,128 | 422 | 644 | 662 | 572 | 570 | 1,064 | 571 | |
| 1995 | 655 | 580 | 1,013 | 1,284 | 577 | 0 | 1,132 | 587 | 894 | 594 | 689 | 690 |
| 1996 | 1,282 | 708 | 596 | 549 | 575 | 451 | 1,136 | 1,585 | 598 | 660 | 666 | 1,147 |
| 1997 | 1,250 | 1,820 | 2,547 | 698 | 0 | 639 | 0 | 599 | 586 | 0 | 0 | 0 |
| 1998 | 428 | 473 | 1,308 | 1,090 | 715 | 593 | 1,042 | 1,124 | 613 | 750 | 0 | 0 |
| 1999 | 0 | 0 | 944 | 620 | 0 | 564 | 582 | 1,023 | 1,030 | 0 | 0 | 0 |
| 2000 | 0 | 599 | 1,159 | 528 | 853 | 1,631 | 1,222 | 988 | 1,192 | 2,137 | 610 | 1,218 |
| 2001 | 1,029 | 0 | 433 | 420 | 648 | 0 | 613 | 877 | 0 | 664 | 0 | 0 |
| 2002 | 0 | 404 | 0 | 0 | 459 | 1,013 | 1,001 | 1,058 | 0 | 1,494 | 632 | 417 |
| 2003 | 501 | 399 | 206 | 192 | 221 | 192 | 790 | 416 | 716 | 157 | 0 | 0 |
| 2004 | 209 | 1,093 | 200 | 210 | 204 | 200 | 663 | 204 | 194 | 731 | 690 | 675 |
| 2005 | 679 | 635 | 844 | 637 | 917 | 421 | 293 | 560 | 675 | 877 | 1,088 | 703 |
| 2006 | 715 | 600 | 508 | 988 | 210 | 478 | 1,228 | 1,456 | 450 | |||
| 2007 | 243 | 250 | 481 | 551 | 210 | 208 | 208 | 210 | ||||
| 2008 | 254 | 257 | 372 | 253 | 702 | 912 | 503 | 503 | 445 | |||
| 2009 | 245 | 242 | 606 | 494 | 252 | 239 | 237 | 251 | 237 | |||
| 2010 | 246 | 246 | 246 | 235 | 241 | 241 | ||||||
| 2011 | 300 | 75 | 240 | |||||||||
| 2012 | 251 | 207 | ||||||||||
| 2013 | 241 | 248 | ||||||||||
| - = No Data Reported; -- = Not Applicable; NA = Not Available; W = Withheld to avoid disclosure of individual company data. |
| Release Date: 3/29/2024 |
| Next Release Date: 4/30/2024 |