|
Download Data (XLS File) |
|
||||||||
|
||||||||
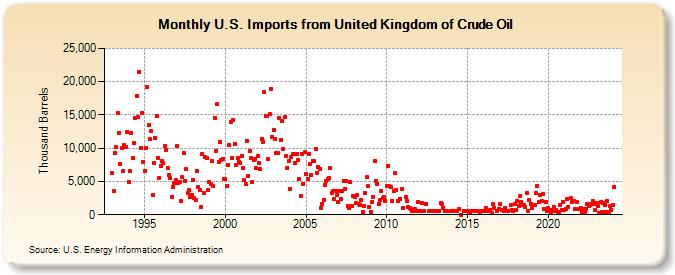
| U.S. Imports from United Kingdom of Crude Oil (Thousand Barrels) | ||||||||
| Year | Jan | Feb | Mar | Apr | May | Jun | Jul | Aug | Sep | Oct | Nov | Dec |
|---|---|---|---|---|---|---|---|---|---|---|---|---|
| 1993 | 6,221 | 3,559 | 9,227 | 10,121 | 15,334 | 12,230 | 7,657 | 10,025 | 6,510 | 10,471 | 10,203 | 12,478 |
| 1994 | 4,978 | 6,502 | 12,217 | 8,456 | 10,706 | 14,552 | 17,914 | 14,667 | 21,523 | 10,016 | 15,222 | 7,902 |
| 1995 | 6,590 | 10,051 | 19,240 | 13,513 | 11,346 | 12,539 | 3,019 | 7,709 | 11,588 | 14,844 | 8,527 | 5,477 |
| 1996 | 7,383 | 8,112 | 7,819 | 10,400 | 9,794 | 7,006 | 6,037 | 5,500 | 2,698 | 4,207 | 4,789 | 5,168 |
| 1997 | 10,315 | 4,815 | 4,976 | 2,110 | 5,609 | 9,334 | 5,119 | 6,830 | 3,286 | 3,678 | 2,598 | 3,030 |
| 1998 | 5,153 | 2,500 | 2,168 | 6,643 | 4,117 | 3,752 | 1,120 | 9,132 | 3,275 | 8,614 | 8,490 | 3,694 |
| 1999 | 4,955 | 4,615 | 8,098 | 4,281 | 14,591 | 9,507 | 16,638 | 7,938 | 10,989 | 8,279 | 8,444 | 5,381 |
| 2000 | 5,299 | 4,312 | 7,429 | 10,433 | 13,922 | 8,457 | 14,190 | 10,628 | 7,439 | 8,514 | 7,904 | 7,805 |
| 2001 | 8,885 | 6,959 | 5,178 | 4,663 | 11,136 | 5,750 | 9,586 | 8,468 | 4,961 | 8,229 | 8,354 | 6,973 |
| 2002 | 8,794 | 7,825 | 6,825 | 11,399 | 10,877 | 18,385 | 14,905 | 14,874 | 8,349 | 15,081 | 18,960 | 11,661 |
| 2003 | 12,728 | 11,401 | 9,270 | 9,247 | 14,570 | 11,196 | 14,080 | 9,879 | 14,616 | 8,830 | 7,032 | 8,089 |
| 2004 | 3,913 | 8,618 | 9,081 | 9,183 | 7,752 | 9,106 | 8,182 | 5,395 | 2,830 | 9,057 | 4,671 | 9,405 |
| 2005 | 6,115 | 5,323 | 9,116 | 7,680 | 6,025 | 8,055 | 8,041 | 9,942 | 6,280 | 7,147 | 6,867 | 1,030 |
| 2006 | 1,675 | 2,286 | 4,510 | 5,072 | 5,384 | 5,544 | 7,095 | 3,317 | 3,626 | 2,296 | 3,576 | 2,890 |
| 2007 | 1,889 | 3,630 | 2,393 | 3,571 | 5,101 | 3,813 | 5,032 | 1,308 | 1,049 | 4,986 | 1,264 | 2,869 |
| 2008 | 2,633 | 1,745 | 2,930 | 1,552 | 1,493 | 2,175 | 427 | 1,275 | 3,236 | 5,612 | 4,254 | 1,166 |
| 2009 | 471 | 1,966 | 2,631 | 8,117 | 5,082 | 4,606 | 1,600 | 2,227 | 3,517 | 2,442 | 2,705 | 2,062 |
| 2010 | 4,243 | 7,280 | 4,389 | 4,114 | 2,070 | 3,505 | 6,208 | 3,740 | 2,093 | 2,386 | 3,845 | |
| 2011 | 1,035 | 2,725 | 2,062 | 1,184 | 1,081 | 861 | 495 | 513 | 862 | 525 | 1,973 | |
| 2012 | 503 | 511 | 1,700 | 525 | 1,681 | 511 | 502 | 512 | ||||
| 2013 | 519 | 506 | 504 | 1,815 | 1,610 | 1,058 | 530 | 617 | 537 | |||
| 2014 | 508 | 512 | 526 | 896 | 1 | 516 | 520 | |||||
| 2015 | 511 | 394 | 411 | 527 | 503 | 508 | 503 | 261 | 536 | |||
| 2016 | 527 | 997 | 513 | 728 | 325 | 1,596 | 1,048 | 540 | 796 | |||
| 2017 | 1,578 | 743 | 510 | 1,040 | 527 | 1,386 | 708 | 495 | 1,656 | |||
| 2018 | 755 | 2,090 | 1,319 | 2,838 | 1,962 | 1,433 | 1,481 | 1,160 | 3,318 | 605 | 2,159 | 1,654 |
| 2019 | 1,030 | 1,530 | 3,289 | 4,305 | 1,836 | 2,941 | 2,008 | 3,039 | 884 | 1,948 | 513 | |
| 2020 | 1,005 | 781 | 396 | 655 | 1,173 | 629 | 758 | 353 | 401 | 1,390 | 739 | 1,951 |
| 2021 | 635 | 802 | 2,389 | 1,106 | 2,503 | 1,869 | 2,056 | 805 | 1,870 | 913 | ||
| 2022 | 1,075 | 399 | 924 | 397 | 907 | 1,631 | 1,366 | 1,401 | 1,660 | 2,098 | 1,623 | 730 |
| 2023 | 1,705 | 1,312 | 324 | 1,933 | 407 | 1,795 | 1,429 | 400 | 2,036 | 400 | 1,371 | 720 |
| 2024 | 1,492 | |||||||||||
| - = No Data Reported; -- = Not Applicable; NA = Not Available; W = Withheld to avoid disclosure of individual company data. |
| Release Date: 3/29/2024 |
| Next Release Date: 4/30/2024 |