|
Download Data (XLS File) |
|
||||||||
|
||||||||
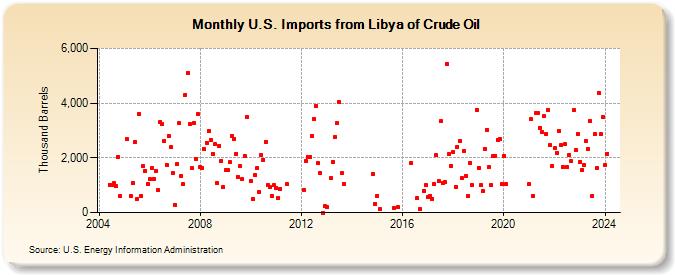
| U.S. Imports from Libya of Crude Oil (Thousand Barrels) | ||||||||
| Year | Jan | Feb | Mar | Apr | May | Jun | Jul | Aug | Sep | Oct | Nov | Dec |
|---|---|---|---|---|---|---|---|---|---|---|---|---|
| 2004 | 1,024 | 999 | 1,064 | 988 | 2,045 | 604 | ||||||
| 2005 | 2,691 | 598 | 1,080 | 2,597 | 500 | 3,604 | 612 | 1,690 | 1,519 | 1,043 | ||
| 2006 | 1,209 | 1,631 | 1,240 | 1,520 | 818 | 3,304 | 3,235 | 2,601 | 1,756 | 2,806 | 2,390 | 1,439 |
| 2007 | 286 | 1,768 | 3,268 | 1,339 | 1,029 | 4,313 | 5,110 | 3,220 | 1,619 | 3,275 | 1,975 | 3,592 |
| 2008 | 1,667 | 1,639 | 2,313 | 2,554 | 2,966 | 2,661 | 2,151 | 2,496 | 1,083 | 2,450 | 1,891 | 920 |
| 2009 | 1,548 | 1,542 | 1,832 | 2,801 | 2,696 | 2,146 | 1,310 | 1,692 | 1,214 | 2,085 | 3,488 | |
| 2010 | 1,169 | 501 | 1,369 | 1,628 | 765 | 2,107 | 1,931 | 2,593 | 1,000 | 943 | 611 | 991 |
| 2011 | 898 | 526 | 870 | 1,034 | ||||||||
| 2012 | 840 | 1,868 | 2,041 | 2,023 | 2,795 | 3,425 | 3,893 | 1,804 | 1,438 | 1 | 230 | |
| 2013 | 200 | 1,248 | 1,857 | 2,769 | 3,269 | 4,035 | 1,428 | 1,058 | ||||
| 2014 | 1,427 | 326 | ||||||||||
| 2015 | 610 | 120 | 159 | 189 | ||||||||
| 2016 | 1,815 | 522 | 124 | 801 | 989 | |||||||
| 2017 | 581 | 616 | 499 | 1,045 | 2,086 | 1,151 | 3,337 | 1,093 | 1,106 | 5,447 | 2,150 | 1,707 |
| 2018 | 2,201 | 948 | 2,406 | 2,623 | 1,248 | 2,251 | 1,353 | 599 | 1,827 | 1,002 | 3,758 | |
| 2019 | 1,645 | 1,000 | 785 | 2,339 | 3,033 | 1,649 | 1,000 | 2,053 | 2,072 | 2,669 | 2,685 | 1,039 |
| 2020 | 2,074 | 1,041 | ||||||||||
| 2021 | 1,036 | 3,405 | 622 | 3,645 | 3,622 | 3,101 | 2,929 | 3,511 | 2,888 | 3,764 | 2,470 | 1,702 |
| 2022 | 2,345 | 2,185 | 2,992 | 2,452 | 1,671 | 2,494 | 1,662 | 2,117 | 1,874 | 3,741 | 2,285 | 2,888 |
| 2023 | 1,860 | 1,571 | 1,740 | 2,623 | 2,337 | 3,352 | 609 | 2,854 | 1,644 | 4,384 | 2,854 | 3,499 |
| 2024 | 1,736 | |||||||||||
| - = No Data Reported; -- = Not Applicable; NA = Not Available; W = Withheld to avoid disclosure of individual company data. |
| Release Date: 3/29/2024 |
| Next Release Date: 4/30/2024 |
Referring Pages: