|
Download Data (XLS File) |
|
||||||||
|
||||||||
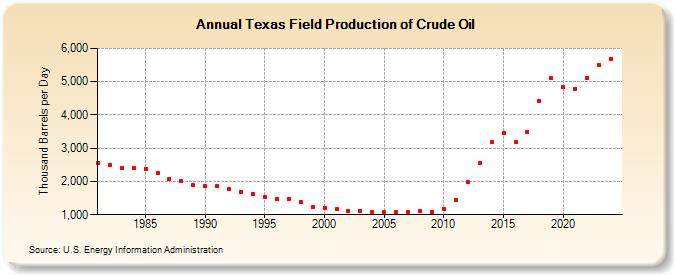
| Texas Field Production of Crude Oil (Thousand Barrels per Day) | ||||||||
| Decade | Year-0 | Year-1 | Year-2 | Year-3 | Year-4 | Year-5 | Year-6 | Year-7 | Year-8 | Year-9 |
|---|---|---|---|---|---|---|---|---|---|---|
| 1980's | 2,554 | 2,488 | 2,419 | 2,413 | 2,381 | 2,245 | 2,085 | 2,010 | 1,885 | |
| 1990's | 1,859 | 1,870 | 1,778 | 1,696 | 1,618 | 1,533 | 1,485 | 1,470 | 1,383 | 1,231 |
| 2000's | 1,211 | 1,162 | 1,112 | 1,098 | 1,073 | 1,076 | 1,075 | 1,072 | 1,109 | 1,094 |
| 2010's | 1,169 | 1,452 | 1,983 | 2,543 | 3,178 | 3,457 | 3,193 | 3,496 | 4,417 | 5,108 |
| 2020's | 4,844 | 4,780 | 5,060 | 5,512 |
| - = No Data Reported; -- = Not Applicable; NA = Not Available; W = Withheld to avoid disclosure of individual company data. |
| Release Date: 4/30/2024 |
| Next Release Date: 8/30/2024 |
Referring Pages: