|
Download Data (XLS File) |
|
||||||||
|
||||||||
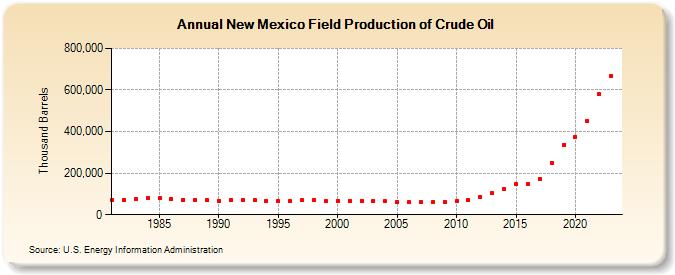
| New Mexico Field Production of Crude Oil (Thousand Barrels) | ||||||||
| Decade | Year-0 | Year-1 | Year-2 | Year-3 | Year-4 | Year-5 | Year-6 | Year-7 | Year-8 | Year-9 |
|---|---|---|---|---|---|---|---|---|---|---|
| 1980's | 71,568 | 71,024 | 75,169 | 79,336 | 78,530 | 75,712 | 72,328 | 71,235 | 68,714 | |
| 1990's | 67,250 | 70,417 | 69,972 | 68,422 | 65,846 | 64,508 | 64,479 | 69,834 | 72,328 | 64,376 |
| 2000's | 67,198 | 68,001 | 67,562 | 66,589 | 64,517 | 60,963 | 59,452 | 59,179 | 60,155 | 61,178 |
| 2010's | 65,569 | 71,518 | 85,551 | 102,789 | 125,061 | 148,095 | 146,634 | 172,378 | 249,211 | 336,535 |
| 2020's | 375,419 | 450,353 | 579,837 | 667,592 |
| - = No Data Reported; -- = Not Applicable; NA = Not Available; W = Withheld to avoid disclosure of individual company data. |
| Release Date: 3/29/2024 |
| Next Release Date: 8/30/2024 |
Referring Pages: