|
Download Data (XLS File) |
|
||||||||
|
||||||||
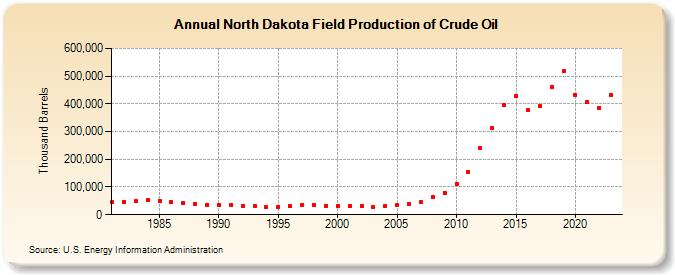
| North Dakota Field Production of Crude Oil (Thousand Barrels) | ||||||||
| Decade | Year-0 | Year-1 | Year-2 | Year-3 | Year-4 | Year-5 | Year-6 | Year-7 | Year-8 | Year-9 |
|---|---|---|---|---|---|---|---|---|---|---|
| 1980's | 45,424 | 47,271 | 50,690 | 52,652 | 50,857 | 45,628 | 41,351 | 39,343 | 36,744 | |
| 1990's | 36,717 | 35,891 | 32,894 | 30,915 | 27,575 | 29,335 | 32,317 | 35,832 | 35,562 | 32,882 |
| 2000's | 32,719 | 31,691 | 30,803 | 29,411 | 31,152 | 35,675 | 39,591 | 44,788 | 62,322 | 79,792 |
| 2010's | 112,555 | 152,436 | 242,354 | 312,357 | 394,623 | 429,627 | 377,817 | 390,605 | 460,428 | 517,687 |
| 2020's | 433,563 | 405,138 | 386,203 | 433,019 |
| - = No Data Reported; -- = Not Applicable; NA = Not Available; W = Withheld to avoid disclosure of individual company data. |
| Release Date: 3/29/2024 |
| Next Release Date: 8/30/2024 |
Referring Pages: