|
Download Data (XLS File) |
|
||||||||
|
||||||||
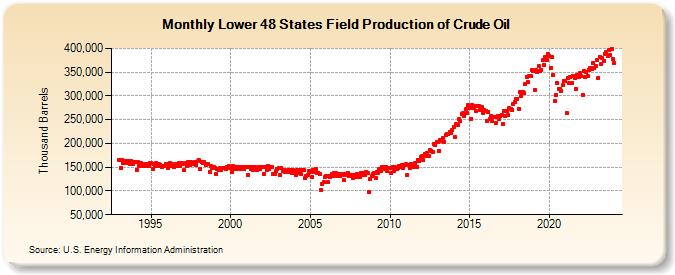
| Lower 48 States Field Production of Crude Oil (Thousand Barrels) | ||||||||
| Year | Jan | Feb | Mar | Apr | May | Jun | Jul | Aug | Sep | Oct | Nov | Dec |
|---|---|---|---|---|---|---|---|---|---|---|---|---|
| 1993 | 164,508 | 148,807 | 165,386 | 158,830 | 163,648 | 158,233 | 162,656 | 162,127 | 157,224 | 162,078 | 157,246 | 160,796 |
| 1994 | 159,922 | 144,851 | 160,039 | 153,233 | 158,418 | 152,815 | 155,191 | 156,381 | 152,839 | 156,689 | 153,313 | 158,837 |
| 1995 | 158,329 | 146,067 | 157,350 | 152,777 | 158,458 | 152,849 | 156,468 | 155,455 | 151,161 | 153,328 | 153,404 | 156,967 |
| 1996 | 156,587 | 147,739 | 158,629 | 152,303 | 156,634 | 151,166 | 155,650 | 156,036 | 152,436 | 158,150 | 152,164 | 158,522 |
| 1997 | 155,699 | 143,654 | 158,751 | 153,324 | 160,298 | 155,456 | 160,315 | 159,564 | 156,291 | 160,612 | 155,439 | 162,477 |
| 1998 | 164,660 | 146,661 | 160,792 | 158,473 | 160,379 | 153,972 | 156,207 | 157,173 | 140,881 | 153,320 | 149,161 | 151,391 |
| 1999 | 148,770 | 136,129 | 147,213 | 144,947 | 148,404 | 143,787 | 149,052 | 147,850 | 146,113 | 151,252 | 148,107 | 151,910 |
| 2000 | 147,564 | 139,797 | 152,070 | 145,384 | 151,308 | 146,928 | 149,633 | 151,108 | 145,964 | 150,145 | 145,414 | 150,193 |
| 2001 | 149,382 | 134,476 | 151,018 | 146,285 | 151,043 | 144,926 | 149,483 | 148,720 | 144,521 | 150,395 | 145,755 | 150,095 |
| 2002 | 149,975 | 135,802 | 150,351 | 145,066 | 151,992 | 145,964 | 149,402 | 149,765 | 135,763 | 135,628 | 141,468 | 146,031 |
| 2003 | 147,907 | 133,500 | 148,225 | 142,648 | 144,863 | 140,038 | 141,728 | 143,492 | 139,357 | 144,038 | 137,503 | 143,092 |
| 2004 | 142,881 | 134,511 | 143,767 | 138,311 | 143,043 | 134,643 | 144,881 | 143,351 | 126,364 | 131,293 | 134,292 | 141,616 |
| 2005 | 140,369 | 128,364 | 145,089 | 140,082 | 145,809 | 138,325 | 138,721 | 135,248 | 101,962 | 114,486 | 119,552 | 128,701 |
| 2006 | 130,700 | 117,915 | 132,520 | 128,443 | 134,830 | 131,455 | 136,808 | 136,987 | 131,275 | 136,221 | 132,277 | 136,429 |
| 2007 | 134,408 | 122,213 | 135,560 | 133,063 | 137,823 | 130,825 | 133,977 | 134,103 | 127,882 | 134,038 | 128,832 | 135,654 |
| 2008 | 136,539 | 128,818 | 138,351 | 134,370 | 138,197 | 134,478 | 140,652 | 138,214 | 98,776 | 124,676 | 130,497 | 136,418 |
| 2009 | 138,428 | 126,879 | 139,794 | 138,767 | 145,677 | 140,958 | 150,248 | 150,212 | 147,203 | 150,838 | 141,973 | 148,709 |
| 2010 | 147,679 | 137,714 | 150,946 | 142,579 | 149,717 | 145,351 | 147,348 | 152,181 | 150,060 | 155,375 | 149,086 | 154,865 |
| 2011 | 156,015 | 134,241 | 155,218 | 148,674 | 156,320 | 151,070 | 154,599 | 159,308 | 150,867 | 165,439 | 163,363 | 171,142 |
| 2012 | 173,098 | 164,899 | 178,547 | 173,029 | 180,530 | 173,472 | 186,497 | 184,328 | 182,880 | 199,110 | 195,876 | 203,034 |
| 2013 | 202,558 | 184,925 | 207,117 | 205,529 | 211,124 | 203,747 | 217,893 | 220,292 | 219,811 | 224,431 | 221,488 | 228,982 |
| 2014 | 233,599 | 213,524 | 240,757 | 239,689 | 251,749 | 247,716 | 261,136 | 264,528 | 258,263 | 271,701 | 264,337 | 280,512 |
| 2015 | 275,356 | 252,051 | 281,383 | 274,433 | 279,034 | 267,314 | 278,841 | 279,039 | 270,140 | 275,974 | 264,278 | 271,322 |
| 2016 | 269,249 | 248,040 | 266,265 | 251,528 | 258,191 | 246,161 | 254,918 | 255,097 | 242,695 | 257,509 | 251,641 | 257,123 |
| 2017 | 259,043 | 240,195 | 267,783 | 257,272 | 269,012 | 259,455 | 273,531 | 272,771 | 271,014 | 283,999 | 287,245 | 293,581 |
| 2018 | 294,270 | 272,970 | 308,565 | 300,054 | 308,096 | 305,674 | 325,554 | 339,870 | 329,135 | 341,663 | 341,641 | 354,887 |
| 2019 | 352,633 | 312,591 | 354,324 | 350,072 | 362,037 | 352,839 | 354,884 | 375,020 | 364,039 | 382,222 | 375,466 | 387,469 |
| 2020 | 383,398 | 358,667 | 382,096 | 343,436 | 288,605 | 302,565 | 327,349 | 314,188 | 314,533 | 309,887 | 321,965 | 331,965 |
| 2021 | 331,051 | 264,860 | 337,832 | 326,150 | 339,339 | 327,778 | 341,386 | 336,902 | 314,752 | 344,931 | 340,078 | 348,037 |
| 2022 | 341,935 | 302,613 | 352,351 | 339,850 | 349,901 | 341,450 | 353,485 | 358,735 | 356,850 | 370,221 | 357,940 | 362,434 |
| 2023 | 375,721 | 338,413 | 382,383 | 366,466 | 380,177 | 374,138 | 388,374 | 392,001 | 384,935 | 396,576 | 386,021 | 398,732 |
| 2024 | 375,307 | |||||||||||
| - = No Data Reported; -- = Not Applicable; NA = Not Available; W = Withheld to avoid disclosure of individual company data. |
| Release Date: 3/29/2024 |
| Next Release Date: 4/30/2024 |
Referring Pages: