|
Download Data (XLS File) |
|
||||||||
|
||||||||
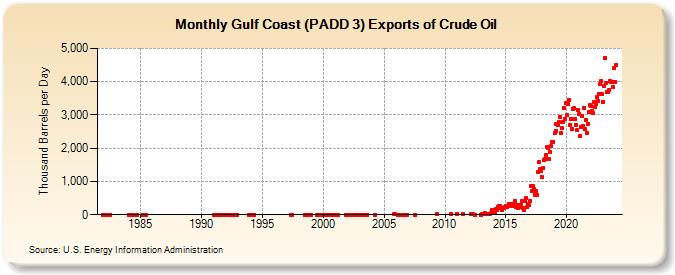
| Gulf Coast (PADD 3) Exports of Crude Oil (Thousand Barrels per Day) | ||||||||
| Year | Jan | Feb | Mar | Apr | May | Jun | Jul | Aug | Sep | Oct | Nov | Dec |
|---|---|---|---|---|---|---|---|---|---|---|---|---|
| 1981 | 0 | |||||||||||
| 1982 | 0 | 0 | 0 | |||||||||
| 1984 | 0 | 0 | 0 | 0 | ||||||||
| 1985 | 0 | 0 | ||||||||||
| 1991 | 0 | 0 | 0 | 0 | 0 | 0 | 0 | 0 | 0 | 0 | 0 | 0 |
| 1992 | 0 | 0 | 0 | 0 | 0 | 0 | 0 | 0 | 0 | 0 | 0 | 0 |
| 1993 | 0 | |||||||||||
| 1994 | 0 | 0 | ||||||||||
| 1997 | 0 | 1 | ||||||||||
| 1998 | 0 | 0 | 0 | 0 | 0 | |||||||
| 1999 | 0 | 0 | 0 | 0 | 0 | 0 | ||||||
| 2000 | 0 | 0 | 0 | 0 | 0 | 0 | 0 | 0 | 0 | 0 | ||
| 2001 | 0 | 0 | 0 | 0 | ||||||||
| 2002 | 2 | 0 | 0 | 0 | 0 | 0 | 0 | |||||
| 2003 | 0 | 0 | 0 | 0 | 0 | 0 | ||||||
| 2004 | 0 | |||||||||||
| 2005 | 10 | 9 | ||||||||||
| 2006 | 6 | 0 | 1 | 0 | ||||||||
| 2007 | 0 | |||||||||||
| 2009 | 17 | |||||||||||
| 2010 | 31 | |||||||||||
| 2011 | 29 | 11 | ||||||||||
| 2012 | 20 | 22 | 0 | 0 | ||||||||
| 2013 | 10 | 14 | 11 | 47 | 34 | 17 | 21 | 23 | 20 | 46 | 144 | 61 |
| 2014 | 144 | 75 | 176 | 144 | 226 | 252 | 274 | 200 | 139 | 202 | 212 | 245 |
| 2015 | 270 | 237 | 268 | 333 | 309 | 262 | 316 | 289 | 268 | 408 | 243 | 292 |
| 2016 | 207 | 220 | 298 | 302 | 401 | 192 | 132 | 410 | 491 | 221 | 330 | 292 |
| 2017 | 421 | 868 | 698 | 862 | 778 | 599 | 710 | 607 | 1,277 | 1,581 | 1,360 | 1,314 |
| 2018 | 1,130 | 1,409 | 1,644 | 1,676 | 1,809 | 2,050 | 1,994 | 1,672 | 1,888 | 2,052 | 2,198 | 2,198 |
| 2019 | 2,453 | 2,715 | 2,511 | 2,700 | 2,774 | 2,931 | 2,453 | 2,593 | 2,784 | 3,218 | 2,886 | 3,354 |
| 2020 | 2,990 | 3,334 | 3,441 | 2,709 | 2,888 | 2,575 | 3,190 | 3,198 | 2,872 | 2,709 | 2,534 | 3,160 |
| 2021 | 3,025 | 2,374 | 2,622 | 2,980 | 2,669 | 3,215 | 2,566 | 2,850 | 2,466 | 2,740 | 3,096 | 3,288 |
| 2022 | 3,261 | 3,116 | 3,050 | 3,388 | 3,233 | 3,315 | 3,525 | 3,421 | 3,614 | 3,920 | 4,020 | 3,625 |
| 2023 | 3,382 | 3,877 | 4,706 | 3,963 | 3,680 | 3,699 | 3,736 | 4,017 | 3,991 | 4,002 | 3,850 | 4,401 |
| 2024 | 3,985 | |||||||||||
| - = No Data Reported; -- = Not Applicable; NA = Not Available; W = Withheld to avoid disclosure of individual company data. |
| Release Date: 3/29/2024 |
| Next Release Date: 4/30/2024 |