|
Download Data (XLS File) |
|
||||||||
|
||||||||
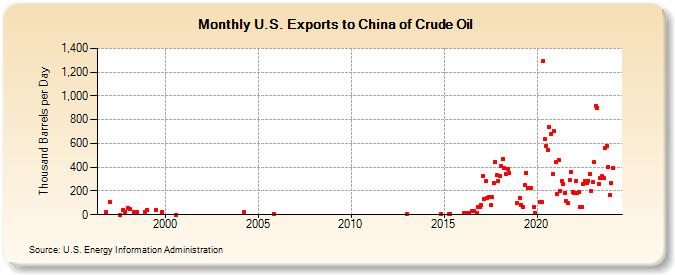
| U.S. Exports to China of Crude Oil (Thousand Barrels per Day) | ||||||||
| Year | Jan | Feb | Mar | Apr | May | Jun | Jul | Aug | Sep | Oct | Nov | Dec |
|---|---|---|---|---|---|---|---|---|---|---|---|---|
| 1996 | 27 | |||||||||||
| 1997 | 109 | 0 | 42 | 27 | ||||||||
| 1998 | 54 | 46 | 26 | 25 | 25 | 26 | ||||||
| 1999 | 42 | 42 | 25 | |||||||||
| 2000 | 0 | |||||||||||
| 2004 | 27 | |||||||||||
| 2005 | 10 | |||||||||||
| 2013 | 9 | |||||||||||
| 2014 | 10 | |||||||||||
| 2015 | 7 | 7 | ||||||||||
| 2016 | 17 | 17 | 16 | 32 | 32 | 17 | 67 | 63 | ||||
| 2017 | 82 | 325 | 134 | 280 | 141 | 153 | 81 | 145 | 268 | 447 | 333 | 281 |
| 2018 | 330 | 412 | 469 | 395 | 345 | 385 | 352 | 95 | ||||
| 2019 | 144 | 82 | 62 | 250 | 355 | 229 | 221 | 227 | 62 | 17 | ||
| 2020 | 107 | 106 | 1,292 | 636 | 578 | 548 | 741 | 679 | 345 | 705 | ||
| 2021 | 445 | 172 | 463 | 202 | 285 | 255 | 184 | 113 | 98 | 292 | 361 | 188 |
| 2022 | 180 | 281 | 184 | 195 | 68 | 63 | 261 | 282 | 265 | 286 | 341 | 201 |
| 2023 | 276 | 441 | 914 | 898 | 259 | 305 | 322 | 309 | 562 | 582 | 404 | 167 |
| 2024 | 269 | |||||||||||
| - = No Data Reported; -- = Not Applicable; NA = Not Available; W = Withheld to avoid disclosure of individual company data. |
| Release Date: 3/29/2024 |
| Next Release Date: 4/30/2024 |