|
Download Data (XLS File) |
|
||||||||
|
||||||||
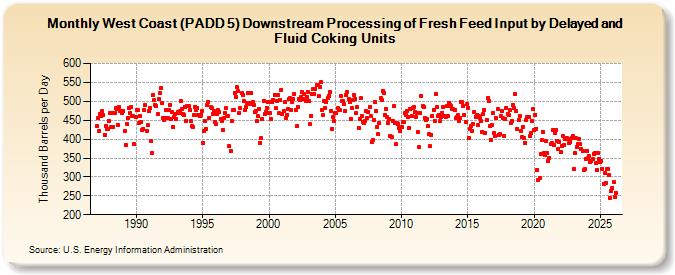
| West Coast (PADD 5) Downstream Processing of Fresh Feed Input by Delayed and Fluid Coking Units (Thousand Barrels per Day) | ||||||||
| Year | Jan | Feb | Mar | Apr | May | Jun | Jul | Aug | Sep | Oct | Nov | Dec |
|---|---|---|---|---|---|---|---|---|---|---|---|---|
| 1987 | 434 | 455 | 422 | 467 | 461 | 474 | 464 | 412 | 434 | 427 | 426 | 448 |
| 1988 | 469 | 431 | 470 | 433 | 470 | 482 | 480 | 438 | 485 | 473 | 474 | 468 |
| 1989 | 473 | 422 | 384 | 440 | 455 | 483 | 468 | 485 | 462 | 460 | 386 | 459 |
| 1990 | 476 | 476 | 443 | 460 | 445 | 424 | 427 | 477 | 489 | 422 | 437 | 474 |
| 1991 | 482 | 396 | 362 | 517 | 503 | 491 | 487 | 467 | 505 | 522 | 534 | 495 |
| 1992 | 455 | 450 | 457 | 477 | 457 | 478 | 491 | 453 | 471 | 433 | 458 | 466 |
| 1993 | 454 | 471 | 469 | 473 | 500 | 480 | 467 | 464 | 486 | 448 | 487 | 487 |
| 1994 | 476 | 447 | 434 | 431 | 465 | 486 | 477 | 483 | 464 | 460 | 463 | 474 |
| 1995 | 391 | 422 | 449 | 428 | 491 | 499 | 457 | 484 | 483 | 466 | 474 | 446 |
| 1996 | 441 | 467 | 476 | 471 | 452 | 447 | 425 | 455 | 469 | 482 | 462 | 461 |
| 1997 | 382 | 369 | 449 | 476 | 477 | 522 | 512 | 538 | 526 | 470 | 483 | 521 |
| 1998 | 516 | 501 | 478 | 485 | 495 | 521 | 495 | 492 | 521 | 497 | 490 | 471 |
| 1999 | 473 | 448 | 460 | 479 | 390 | 402 | 452 | 502 | 466 | 472 | 482 | 499 |
| 2000 | 468 | 469 | 453 | 497 | 503 | 517 | 482 | 501 | 516 | 469 | 504 | 530 |
| 2001 | 467 | 475 | 498 | 457 | 465 | 480 | 505 | 508 | 478 | 498 | 506 | 519 |
| 2002 | 478 | 434 | 486 | 506 | 504 | 511 | 524 | 506 | 519 | 502 | 511 | 525 |
| 2003 | 500 | 439 | 462 | 520 | 532 | 518 | 533 | 542 | 542 | 515 | 539 | 550 |
| 2004 | 477 | 465 | 501 | 483 | 498 | 509 | 514 | 524 | 475 | 427 | 458 | 449 |
| 2005 | 469 | 469 | 481 | 477 | 476 | 514 | 501 | 500 | 492 | 474 | 517 | 525 |
| 2006 | 506 | 499 | 453 | 482 | 503 | 516 | 507 | 468 | 485 | 430 | 454 | 508 |
| 2007 | 462 | 444 | 442 | 448 | 474 | 455 | 472 | 485 | 460 | 393 | 398 | 450 |
| 2008 | 498 | 473 | 433 | 413 | 443 | 508 | 504 | 528 | 522 | 465 | 480 | 459 |
| 2009 | 443 | 453 | 409 | 405 | 449 | 487 | 443 | 387 | 443 | 440 | 430 | 422 |
| 2010 | 433 | 444 | 444 | 468 | 464 | 475 | 459 | 430 | 479 | 462 | 481 | 485 |
| 2011 | 471 | 459 | 469 | 419 | 378 | 469 | 513 | 487 | 486 | 457 | 451 | 452 |
| 2012 | 434 | 413 | 381 | 411 | 460 | 478 | 449 | 519 | 484 | 461 | 464 | 447 |
| 2013 | 458 | 470 | 485 | 462 | 458 | 488 | 460 | 496 | 491 | 488 | 480 | 479 |
| 2014 | 477 | 455 | 459 | 463 | 449 | 455 | 499 | 497 | 488 | 465 | 446 | 492 |
| 2015 | 483 | 402 | 428 | 435 | 422 | 441 | 472 | 459 | 464 | 436 | 461 | 455 |
| 2016 | 447 | 420 | 467 | 477 | 417 | 450 | 510 | 501 | 435 | 397 | 436 | 469 |
| 2017 | 416 | 409 | 455 | 479 | 412 | 414 | 462 | 474 | 455 | 407 | 454 | 483 |
| 2018 | 467 | 464 | 477 | 443 | 447 | 491 | 482 | 518 | 474 | 427 | 451 | 462 |
| 2019 | 422 | 405 | 432 | 403 | 390 | 451 | 459 | 458 | 407 | 415 | 448 | 479 |
| 2020 | 424 | 464 | 428 | 319 | 292 | 297 | 360 | 397 | 420 | 364 | 359 | 394 |
| 2021 | 363 | 341 | 350 | 387 | 389 | 424 | 384 | 416 | 424 | 395 | 374 | 392 |
| 2022 | 366 | 382 | 409 | 384 | 401 | 402 | 402 | 401 | 389 | 393 | 402 | 409 |
| 2023 | 321 | 362 | 402 | 378 | 387 | 401 | 386 | 374 | 369 | 317 | 321 | 348 |
| 2024 | 384 | |||||||||||
| - = No Data Reported; -- = Not Applicable; NA = Not Available; W = Withheld to avoid disclosure of individual company data. |
| Release Date: 3/29/2024 |
| Next Release Date: 4/30/2024 |