|
Download Data (XLS File) |
|
||||||||
|
||||||||
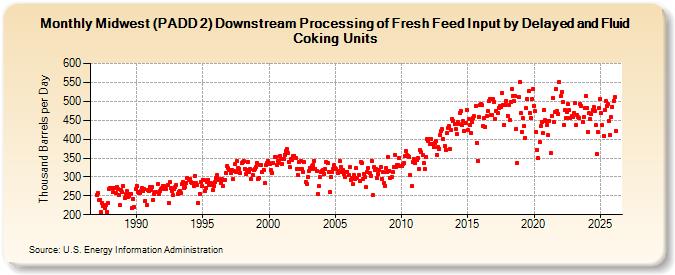
| Midwest (PADD 2) Downstream Processing of Fresh Feed Input by Delayed and Fluid Coking Units (Thousand Barrels per Day) | ||||||||
| Year | Jan | Feb | Mar | Apr | May | Jun | Jul | Aug | Sep | Oct | Nov | Dec |
|---|---|---|---|---|---|---|---|---|---|---|---|---|
| 1987 | 252 | 258 | 238 | 239 | 206 | 231 | 223 | 218 | 226 | 208 | 231 | 269 |
| 1988 | 270 | 271 | 271 | 259 | 270 | 257 | 273 | 267 | 252 | 225 | 265 | 259 |
| 1989 | 276 | 244 | 254 | 262 | 246 | 249 | 256 | 255 | 219 | 241 | 220 | 269 |
| 1990 | 277 | 260 | 257 | 258 | 264 | 271 | 263 | 268 | 236 | 225 | 265 | 263 |
| 1991 | 274 | 265 | 273 | 239 | 255 | 259 | 259 | 281 | 255 | 263 | 268 | 270 |
| 1992 | 276 | 275 | 269 | 268 | 279 | 231 | 286 | 271 | 263 | 251 | 268 | 272 |
| 1993 | 279 | 255 | 261 | 264 | 257 | 280 | 286 | 271 | 274 | 283 | 296 | 293 |
| 1994 | 294 | 286 | 285 | 285 | 275 | 303 | 284 | 278 | 231 | 256 | 286 | 276 |
| 1995 | 293 | 291 | 263 | 270 | 286 | 292 | 278 | 283 | 278 | 265 | 276 | 286 |
| 1996 | 296 | 304 | 294 | 293 | 285 | 294 | 277 | 293 | 293 | 311 | 329 | 323 |
| 1997 | 318 | 311 | 318 | 294 | 315 | 333 | 312 | 341 | 324 | 322 | 310 | 338 |
| 1998 | 340 | 342 | 321 | 307 | 318 | 340 | 312 | 322 | 294 | 304 | 317 | 321 |
| 1999 | 325 | 337 | 294 | 297 | 332 | 332 | 313 | 319 | 283 | 332 | 337 | 343 |
| 2000 | 338 | 333 | 317 | 311 | 337 | 352 | 352 | 331 | 341 | 337 | 355 | 347 |
| 2001 | 335 | 348 | 359 | 368 | 374 | 362 | 340 | 325 | 348 | 345 | 354 | 356 |
| 2002 | 351 | 322 | 305 | 340 | 322 | 341 | 320 | 313 | 340 | 287 | 281 | 300 |
| 2003 | 316 | 324 | 321 | 328 | 332 | 343 | 322 | 316 | 256 | 275 | 300 | 314 |
| 2004 | 315 | 319 | 309 | 320 | 339 | 337 | 313 | 260 | 301 | 312 | 322 | 332 |
| 2005 | 324 | 320 | 310 | 315 | 342 | 326 | 312 | 317 | 307 | 299 | 313 | 313 |
| 2006 | 305 | 325 | 293 | 298 | 280 | 305 | 295 | 324 | 298 | 304 | 290 | 340 |
| 2007 | 338 | 294 | 308 | 299 | 272 | 314 | 324 | 310 | 303 | 343 | 251 | 325 |
| 2008 | 318 | 321 | 297 | 309 | 319 | 326 | 295 | 313 | 284 | 277 | 323 | 313 |
| 2009 | 352 | 316 | 298 | 299 | 314 | 326 | 359 | 326 | 332 | 332 | 350 | 330 |
| 2010 | 328 | 335 | 336 | 355 | 368 | 357 | 356 | 353 | 305 | 275 | 339 | 348 |
| 2011 | 336 | 346 | 344 | 350 | 321 | 370 | 365 | 358 | 338 | 321 | 353 | 399 |
| 2012 | 395 | 399 | 387 | 399 | 386 | 380 | 390 | 394 | 359 | 378 | 375 | 411 |
| 2013 | 421 | 426 | 399 | 382 | 372 | 415 | 429 | 434 | 373 | 424 | 453 | 449 |
| 2014 | 439 | 426 | 414 | 445 | 439 | 468 | 473 | 436 | 447 | 422 | 442 | 478 |
| 2015 | 424 | 453 | 436 | 416 | 446 | 457 | 460 | 487 | 391 | 343 | 459 | 491 |
| 2016 | 494 | 489 | 434 | 455 | 432 | 460 | 473 | 500 | 505 | 465 | 464 | 506 |
| 2017 | 499 | 453 | 475 | 469 | 483 | 487 | 484 | 522 | 491 | 438 | 490 | 502 |
| 2018 | 462 | 491 | 450 | 498 | 533 | 514 | 500 | 515 | 427 | 338 | 511 | 551 |
| 2019 | 468 | 420 | 455 | 434 | 404 | 482 | 506 | 526 | 470 | 455 | 506 | 533 |
| 2020 | 488 | 473 | 419 | 371 | 350 | 392 | 434 | 445 | 415 | 478 | 450 | 449 |
| 2021 | 438 | 410 | 448 | 363 | 460 | 510 | 444 | 471 | 532 | 475 | 467 | 551 |
| 2022 | 513 | 524 | 497 | 438 | 476 | 457 | 471 | 492 | 476 | 455 | 461 | 459 |
| 2023 | 469 | 496 | 438 | 464 | 458 | 456 | 493 | 488 | 446 | 458 | 481 | 514 |
| 2024 | 470 | |||||||||||
| - = No Data Reported; -- = Not Applicable; NA = Not Available; W = Withheld to avoid disclosure of individual company data. |
| Release Date: 3/29/2024 |
| Next Release Date: 4/30/2024 |