|
Download Data (XLS File) |
|
||||||||
|
||||||||
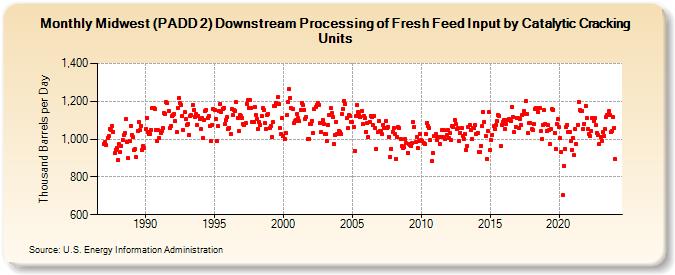
| Midwest (PADD 2) Downstream Processing of Fresh Feed Input by Catalytic Cracking Units (Thousand Barrels per Day) | ||||||||
| Year | Jan | Feb | Mar | Apr | May | Jun | Jul | Aug | Sep | Oct | Nov | Dec |
|---|---|---|---|---|---|---|---|---|---|---|---|---|
| 1987 | 975 | 984 | 967 | 1,008 | 1,016 | 1,056 | 1,050 | 1,070 | 1,037 | 925 | 944 | 952 |
| 1988 | 889 | 972 | 931 | 964 | 994 | 1,020 | 1,032 | 1,105 | 984 | 898 | 992 | 1,070 |
| 1989 | 1,023 | 1,010 | 941 | 945 | 905 | 1,044 | 1,090 | 1,047 | 1,071 | 943 | 964 | 954 |
| 1990 | 1,054 | 1,114 | 1,038 | 1,026 | 1,025 | 1,050 | 1,163 | 1,164 | 1,159 | 1,050 | 991 | 1,046 |
| 1991 | 1,007 | 1,031 | 1,042 | 1,057 | 1,139 | 1,133 | 1,196 | 1,192 | 1,150 | 1,057 | 1,070 | 1,123 |
| 1992 | 1,128 | 1,133 | 1,094 | 1,036 | 1,164 | 1,220 | 1,189 | 1,183 | 1,123 | 1,048 | 1,141 | 1,104 |
| 1993 | 1,076 | 1,082 | 1,024 | 1,121 | 1,126 | 1,181 | 1,155 | 1,116 | 1,135 | 1,077 | 1,123 | 1,108 |
| 1994 | 1,052 | 1,110 | 1,008 | 1,103 | 1,149 | 1,156 | 1,112 | 1,123 | 1,069 | 991 | 1,075 | 1,158 |
| 1995 | 1,152 | 1,104 | 988 | 1,068 | 1,149 | 1,185 | 1,143 | 1,161 | 1,166 | 1,079 | 1,101 | 1,115 |
| 1996 | 1,056 | 1,061 | 1,025 | 1,158 | 1,127 | 1,152 | 1,149 | 1,195 | 1,114 | 1,043 | 1,125 | 1,120 |
| 1997 | 1,112 | 1,081 | 1,075 | 1,083 | 1,188 | 1,205 | 1,166 | 1,206 | 1,166 | 1,093 | 1,091 | 1,171 |
| 1998 | 1,128 | 1,107 | 1,055 | 1,089 | 1,075 | 1,121 | 1,164 | 1,154 | 1,083 | 1,055 | 1,129 | 1,134 |
| 1999 | 1,059 | 1,071 | 1,010 | 1,090 | 1,176 | 1,177 | 1,190 | 1,221 | 1,188 | 1,059 | 1,026 | 1,109 |
| 2000 | 1,017 | 1,002 | 1,033 | 1,126 | 1,198 | 1,263 | 1,220 | 1,162 | 1,158 | 1,084 | 1,094 | 1,100 |
| 2001 | 1,134 | 1,109 | 1,094 | 1,155 | 1,192 | 1,179 | 1,156 | 1,104 | 1,118 | 999 | 1,003 | 1,079 |
| 2002 | 1,081 | 1,098 | 1,031 | 1,159 | 1,172 | 1,181 | 1,191 | 1,183 | 1,086 | 1,038 | 1,103 | 1,082 |
| 2003 | 1,029 | 1,025 | 992 | 1,077 | 1,127 | 1,163 | 1,136 | 1,118 | 973 | 1,020 | 1,091 | 1,025 |
| 2004 | 1,041 | 1,040 | 1,025 | 1,134 | 1,161 | 1,202 | 1,185 | 1,109 | 1,057 | 1,127 | 1,121 | 1,093 |
| 2005 | 1,089 | 1,062 | 938 | 1,122 | 1,180 | 1,144 | 1,127 | 1,117 | 1,149 | 1,079 | 1,123 | 1,109 |
| 2006 | 1,040 | 1,083 | 1,009 | 1,093 | 1,121 | 1,115 | 1,074 | 1,123 | 1,061 | 949 | 1,035 | 1,097 |
| 2007 | 1,044 | 1,045 | 1,025 | 1,076 | 1,061 | 1,095 | 1,061 | 1,066 | 1,012 | 906 | 949 | 1,039 |
| 2008 | 1,059 | 1,028 | 897 | 1,012 | 1,062 | 1,059 | 1,001 | 963 | 951 | 956 | 998 | 978 |
| 2009 | 929 | 974 | 971 | 965 | 978 | 1,089 | 1,063 | 983 | 1,012 | 953 | 990 | 1,027 |
| 2010 | 996 | 989 | 980 | 973 | 1,026 | 1,086 | 1,069 | 1,061 | 993 | 884 | 928 | 1,015 |
| 2011 | 1,016 | 1,026 | 996 | 1,013 | 974 | 1,012 | 1,048 | 1,011 | 1,047 | 999 | 1,022 | 1,048 |
| 2012 | 1,004 | 1,032 | 993 | 1,070 | 1,064 | 1,102 | 1,082 | 1,051 | 1,057 | 991 | 1,031 | 1,058 |
| 2013 | 1,018 | 999 | 1,028 | 944 | 966 | 1,062 | 1,077 | 1,046 | 1,001 | 1,057 | 1,060 | 1,074 |
| 2014 | 1,025 | 1,033 | 934 | 934 | 965 | 1,067 | 1,144 | 1,089 | 1,018 | 895 | 1,041 | 1,141 |
| 2015 | 942 | 993 | 1,023 | 1,070 | 1,051 | 1,072 | 1,097 | 1,126 | 1,124 | 961 | 1,075 | 1,092 |
| 2016 | 1,100 | 1,052 | 1,080 | 1,100 | 1,105 | 1,102 | 1,094 | 1,169 | 1,119 | 1,035 | 1,066 | 1,114 |
| 2017 | 1,109 | 1,059 | 1,107 | 1,076 | 1,128 | 1,147 | 1,132 | 1,199 | 1,134 | 1,031 | 1,083 | 1,086 |
| 2018 | 1,053 | 1,049 | 1,079 | 1,160 | 1,167 | 1,160 | 1,141 | 1,166 | 1,042 | 1,001 | 1,076 | 1,154 |
| 2019 | 1,079 | 1,041 | 1,075 | 1,046 | 972 | 1,053 | 1,158 | 1,156 | 1,034 | 949 | 1,079 | 1,104 |
| 2020 | 1,062 | 1,005 | 932 | 702 | 858 | 950 | 1,062 | 1,076 | 1,035 | 1,039 | 990 | 944 |
| 2021 | 1,008 | 914 | 1,053 | 973 | 1,076 | 1,198 | 1,154 | 1,147 | 1,146 | 1,056 | 1,082 | 1,177 |
| 2022 | 1,113 | 1,055 | 1,027 | 1,016 | 1,044 | 1,112 | 1,094 | 1,111 | 1,073 | 1,032 | 1,021 | 975 |
| 2023 | 1,009 | 992 | 1,038 | 1,015 | 1,051 | 1,119 | 1,126 | 1,147 | 1,128 | 1,036 | 1,044 | 1,115 |
| 2024 | 1,061 | |||||||||||
| - = No Data Reported; -- = Not Applicable; NA = Not Available; W = Withheld to avoid disclosure of individual company data. |
| Release Date: 3/29/2024 |
| Next Release Date: 4/30/2024 |