|
Download Data (XLS File) |
|
||||||||
|
||||||||
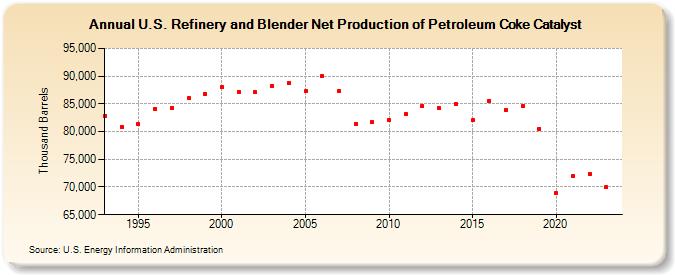
| U.S. Refinery and Blender Net Production of Petroleum Coke Catalyst (Thousand Barrels) | ||||||||
| Decade | Year-0 | Year-1 | Year-2 | Year-3 | Year-4 | Year-5 | Year-6 | Year-7 | Year-8 | Year-9 |
|---|---|---|---|---|---|---|---|---|---|---|
| 1990's | 82,876 | 80,850 | 81,347 | 84,134 | 84,294 | 85,980 | 86,754 | |||
| 2000's | 87,956 | 87,176 | 87,074 | 88,294 | 88,781 | 87,228 | 90,033 | 87,367 | 81,449 | 81,655 |
| 2010's | 82,070 | 83,143 | 84,652 | 84,161 | 84,910 | 82,029 | 85,599 | 83,957 | 84,573 | 80,541 |
| 2020's | 68,846 | 71,955 | 72,377 | 69,921 |
| - = No Data Reported; -- = Not Applicable; NA = Not Available; W = Withheld to avoid disclosure of individual company data. |
| Release Date: 3/29/2024 |
| Next Release Date: 8/30/2024 |