|
Download Data (XLS File) |
|
||||||||
|
||||||||
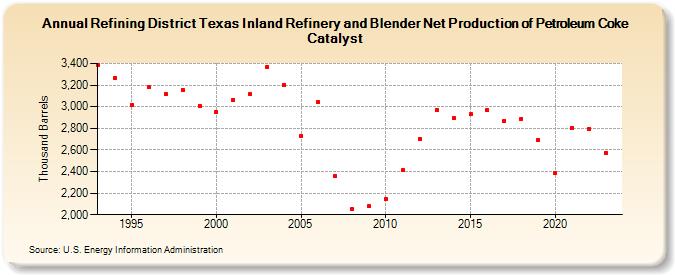
| Refining District Texas Inland Refinery and Blender Net Production of Petroleum Coke Catalyst (Thousand Barrels) | ||||||||
| Decade | Year-0 | Year-1 | Year-2 | Year-3 | Year-4 | Year-5 | Year-6 | Year-7 | Year-8 | Year-9 |
|---|---|---|---|---|---|---|---|---|---|---|
| 1990's | 3,388 | 3,264 | 3,019 | 3,181 | 3,116 | 3,156 | 3,009 | |||
| 2000's | 2,952 | 3,063 | 3,115 | 3,371 | 3,201 | 2,730 | 3,043 | 2,358 | 2,050 | 2,078 |
| 2010's | 2,145 | 2,410 | 2,702 | 2,966 | 2,895 | 2,930 | 2,969 | 2,870 | 2,890 | 2,694 |
| 2020's | 2,388 | 2,806 | 2,796 | 2,574 |
| - = No Data Reported; -- = Not Applicable; NA = Not Available; W = Withheld to avoid disclosure of individual company data. |
| Release Date: 3/29/2024 |
| Next Release Date: 8/30/2024 |