|
Download Data (XLS File) |
|
||||||||
|
||||||||
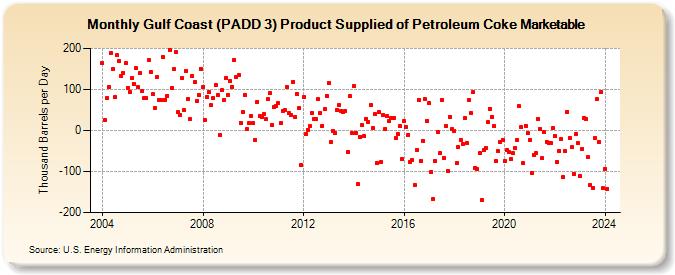
| Gulf Coast (PADD 3) Product Supplied of Petroleum Coke Marketable (Thousand Barrels per Day) | ||||||||
| Year | Jan | Feb | Mar | Apr | May | Jun | Jul | Aug | Sep | Oct | Nov | Dec |
|---|---|---|---|---|---|---|---|---|---|---|---|---|
| 2004 | 164 | 26 | 78 | 106 | 189 | 149 | 81 | 183 | 169 | 132 | 140 | 164 |
| 2005 | 104 | 93 | 129 | 114 | 152 | 105 | 139 | 96 | 79 | 79 | 171 | 143 |
| 2006 | 88 | 55 | 130 | 74 | 75 | 178 | 75 | 85 | 197 | 104 | 149 | 192 |
| 2007 | 44 | 38 | 128 | 49 | 146 | 77 | 27 | 132 | 117 | 73 | 87 | 151 |
| 2008 | 107 | 25 | 82 | 93 | 61 | 79 | 111 | 86 | -10 | 98 | 75 | 128 |
| 2009 | 87 | 120 | 107 | 172 | 130 | 134 | 19 | 45 | 87 | 4 | 17 | 36 |
| 2010 | 18 | -22 | 70 | 35 | 34 | 39 | 27 | 76 | 91 | 13 | 56 | 60 |
| 2011 | 66 | 18 | 48 | 49 | 107 | 42 | 38 | 119 | 33 | 89 | 55 | -85 |
| 2012 | 81 | -9 | 2 | 10 | 42 | 29 | 29 | 76 | 42 | 12 | 52 | 85 |
| 2013 | 116 | -29 | -2 | -7 | 51 | 62 | 47 | 46 | 47 | -52 | 83 | -5 |
| 2014 | 108 | -5 | -131 | -15 | 14 | -14 | 28 | 21 | 62 | 6 | 39 | -79 |
| 2015 | 44 | -77 | 38 | 4 | 35 | 22 | 31 | 31 | -19 | -9 | 10 | -70 |
| 2016 | 22 | 8 | -10 | -76 | -72 | -133 | -47 | 75 | -74 | -25 | 76 | 24 |
| 2017 | 66 | -101 | -167 | -74 | -3 | -56 | 75 | -66 | 11 | -99 | 34 | 4 |
| 2018 | -1 | -80 | -41 | -22 | -34 | 30 | -31 | 75 | 42 | 93 | -91 | -95 |
| 2019 | -56 | -169 | -48 | -43 | 20 | 53 | 34 | 10 | -75 | -51 | -27 | -22 |
| 2020 | -74 | -48 | -53 | -69 | -56 | -42 | -22 | 59 | 8 | -80 | 12 | -7 |
| 2021 | -22 | -103 | -59 | -56 | 29 | 3 | -68 | -4 | -27 | -30 | -30 | 6 |
| 2022 | -13 | -77 | -51 | -21 | -114 | -51 | 46 | -18 | -41 | -105 | -8 | -31 |
| 2023 | -111 | -44 | 31 | 27 | -65 | -133 | -139 | -19 | 76 | -27 | 93 | -141 |
| 2024 | -94 | |||||||||||
| - = No Data Reported; -- = Not Applicable; NA = Not Available; W = Withheld to avoid disclosure of individual company data. |
| Release Date: 3/29/2024 |
| Next Release Date: 4/30/2024 |