|
Download Data (XLS File) |
|
||||||||
|
||||||||
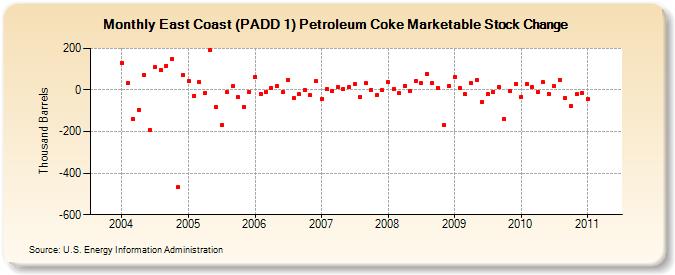
| East Coast (PADD 1) Petroleum Coke Marketable Stock Change (Thousand Barrels) | ||||||||
| Year | Jan | Feb | Mar | Apr | May | Jun | Jul | Aug | Sep | Oct | Nov | Dec |
|---|---|---|---|---|---|---|---|---|---|---|---|---|
| 2004 | 131 | 33 | -138 | -94 | 71 | -191 | 109 | 95 | 117 | 151 | -468 | 71 |
| 2005 | 43 | -27 | 38 | -14 | 191 | -84 | -169 | -12 | 19 | -36 | -80 | -8 |
| 2006 | 64 | -18 | -9 | 10 | 18 | -12 | 48 | -41 | -21 | 1 | -26 | 42 |
| 2007 | -44 | 4 | -4 | 12 | 5 | 13 | 30 | -32 | 32 | 2 | -26 | -2 |
| 2008 | 36 | 5 | -16 | 19 | -3 | 42 | 32 | 79 | 35 | 11 | -169 | 20 |
| 2009 | 60 | 8 | -21 | 32 | 49 | -56 | -21 | -8 | 14 | -141 | -7 | 28 |
| 2010 | -32 | 29 | 12 | -9 | 37 | -18 | 18 | 50 | -38 | -79 | -21 | -14 |
| 2011 | -43 | |||||||||||
| - = No Data Reported; -- = Not Applicable; NA = Not Available; W = Withheld to avoid disclosure of individual company data. |
| Release Date: 3/29/2024 |
| Next Release Date: 4/30/2024 |