|
Download Data (XLS File) |
|
||||||||
|
||||||||
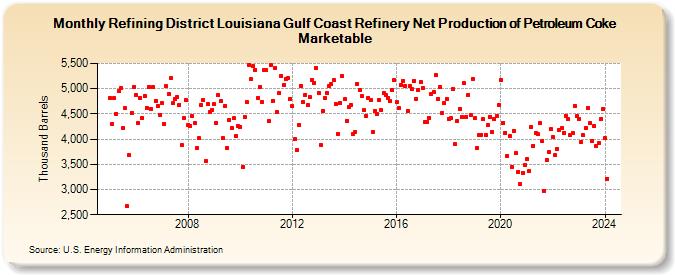
| Refining District Louisiana Gulf Coast Refinery Net Production of Petroleum Coke Marketable (Thousand Barrels) | ||||||||
| Year | Jan | Feb | Mar | Apr | May | Jun | Jul | Aug | Sep | Oct | Nov | Dec |
|---|---|---|---|---|---|---|---|---|---|---|---|---|
| 2005 | 4,823 | 4,304 | 4,819 | 4,503 | 4,945 | 5,005 | 4,230 | 4,608 | 2,664 | 3,678 | 4,526 | 5,038 |
| 2006 | 4,884 | 4,323 | 4,815 | 4,427 | 4,855 | 4,619 | 5,035 | 4,598 | 5,031 | 4,763 | 4,657 | 4,486 |
| 2007 | 4,709 | 4,300 | 5,044 | 4,898 | 5,205 | 4,710 | 4,799 | 4,842 | 4,685 | 3,878 | 4,415 | 4,781 |
| 2008 | 4,288 | 4,267 | 4,452 | 4,323 | 3,818 | 4,014 | 4,685 | 4,773 | 3,570 | 4,700 | 4,540 | 4,584 |
| 2009 | 4,690 | 4,317 | 4,866 | 4,755 | 4,021 | 4,657 | 3,831 | 4,388 | 4,229 | 4,412 | 4,064 | 4,256 |
| 2010 | 4,249 | 3,444 | 4,439 | 4,732 | 5,470 | 5,183 | 5,441 | 5,378 | 4,821 | 5,029 | 4,740 | 5,380 |
| 2011 | 5,374 | 4,357 | 5,472 | 4,763 | 5,418 | 4,530 | 4,917 | 5,247 | 5,083 | 5,200 | 5,206 | 4,796 |
| 2012 | 4,652 | 3,993 | 3,779 | 4,289 | 5,055 | 4,730 | 4,875 | 4,669 | 4,840 | 5,172 | 5,114 | 5,419 |
| 2013 | 4,924 | 3,887 | 4,566 | 4,812 | 4,924 | 5,054 | 5,091 | 5,169 | 4,694 | 4,110 | 4,721 | 5,247 |
| 2014 | 4,786 | 4,360 | 4,638 | 4,680 | 4,106 | 4,144 | 5,098 | 4,971 | 4,850 | 4,570 | 4,460 | 4,817 |
| 2015 | 4,770 | 4,143 | 4,567 | 4,494 | 4,777 | 4,571 | 4,915 | 4,869 | 4,821 | 4,746 | 4,974 | 5,163 |
| 2016 | 4,726 | 4,619 | 5,073 | 5,158 | 5,052 | 4,561 | 5,047 | 5,003 | 5,161 | 4,804 | 4,981 | 5,133 |
| 2017 | 5,021 | 4,344 | 4,345 | 4,415 | 4,904 | 4,935 | 5,267 | 4,803 | 5,032 | 4,513 | 4,711 | 4,799 |
| 2018 | 4,406 | 4,413 | 4,998 | 3,897 | 4,359 | 4,603 | 4,445 | 5,104 | 4,446 | 4,879 | 4,472 | 5,197 |
| 2019 | 4,409 | 3,820 | 4,091 | 4,083 | 4,393 | 4,085 | 4,272 | 4,445 | 4,143 | 4,390 | 4,461 | 4,674 |
| 2020 | 5,174 | 4,327 | 4,125 | 3,668 | 4,063 | 3,447 | 4,170 | 3,722 | 3,343 | 3,101 | 3,331 | 3,477 |
| 2021 | 3,602 | 3,371 | 4,249 | 3,873 | 4,117 | 4,093 | 4,317 | 3,956 | 2,976 | 3,592 | 3,739 | 4,191 |
| 2022 | 4,034 | 3,677 | 3,813 | 4,187 | 4,217 | 4,129 | 4,468 | 4,397 | 4,077 | 4,118 | 4,657 | 4,449 |
| 2023 | 4,401 | 3,951 | 4,073 | 4,221 | 4,616 | 4,311 | 3,959 | 4,265 | 3,866 | 3,917 | 4,398 | 4,600 |
| 2024 | 4,018 | |||||||||||
| - = No Data Reported; -- = Not Applicable; NA = Not Available; W = Withheld to avoid disclosure of individual company data. |
| Release Date: 3/29/2024 |
| Next Release Date: 4/30/2024 |