|
Download Data (XLS File) |
|
||||||||
|
||||||||
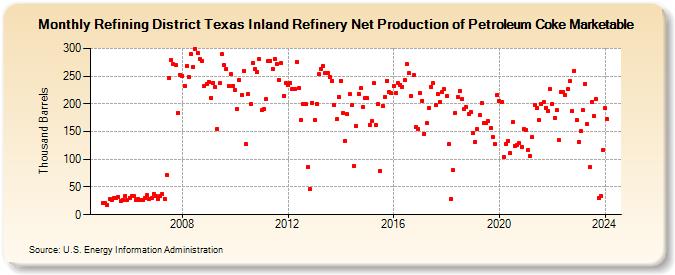
| Refining District Texas Inland Refinery Net Production of Petroleum Coke Marketable (Thousand Barrels) | ||||||||
| Year | Jan | Feb | Mar | Apr | May | Jun | Jul | Aug | Sep | Oct | Nov | Dec |
|---|---|---|---|---|---|---|---|---|---|---|---|---|
| 2005 | 22 | 21 | 17 | 28 | 26 | 30 | 30 | 32 | 25 | 27 | 33 | 27 |
| 2006 | 30 | 34 | 33 | 27 | 28 | 27 | 26 | 31 | 35 | 28 | 31 | 38 |
| 2007 | 33 | 29 | 33 | 37 | 29 | 72 | 247 | 279 | 271 | 270 | 184 | 252 |
| 2008 | 251 | 233 | 269 | 248 | 289 | 267 | 299 | 292 | 280 | 278 | 232 | 236 |
| 2009 | 240 | 211 | 237 | 230 | 155 | 237 | 289 | 270 | 262 | 232 | 253 | 233 |
| 2010 | 225 | 191 | 243 | 216 | 260 | 127 | 217 | 199 | 274 | 263 | 258 | 281 |
| 2011 | 188 | 191 | 208 | 278 | 278 | 263 | 281 | 271 | 243 | 273 | 215 | 238 |
| 2012 | 234 | 238 | 227 | 227 | 276 | 229 | 171 | 200 | 199 | 86 | 46 | 202 |
| 2013 | 171 | 200 | 253 | 263 | 269 | 255 | 255 | 249 | 242 | 198 | 172 | 213 |
| 2014 | 242 | 184 | 133 | 181 | 217 | 197 | 88 | 160 | 218 | 228 | 195 | 210 |
| 2015 | 210 | 162 | 169 | 237 | 162 | 199 | 79 | 196 | 213 | 242 | 221 | 219 |
| 2016 | 232 | 220 | 237 | 234 | 231 | 243 | 271 | 255 | 214 | 252 | 158 | 155 |
| 2017 | 219 | 206 | 146 | 165 | 193 | 231 | 237 | 197 | 218 | 204 | 222 | 226 |
| 2018 | 215 | 127 | 29 | 80 | 184 | 212 | 223 | 209 | 190 | 194 | 182 | 185 |
| 2019 | 147 | 132 | 154 | 179 | 201 | 166 | 165 | 169 | 156 | 140 | 128 | 216 |
| 2020 | 205 | 203 | 105 | 128 | 133 | 111 | 167 | 124 | 126 | 129 | 122 | 155 |
| 2021 | 153 | 117 | 106 | 140 | 198 | 193 | 170 | 200 | 203 | 193 | 187 | 227 |
| 2022 | 200 | 175 | 188 | 134 | 221 | 221 | 216 | 226 | 241 | 187 | 260 | 171 |
| 2023 | 132 | 151 | 188 | 236 | 164 | 86 | 204 | 178 | 208 | 30 | 34 | 116 |
| 2024 | 192 | |||||||||||
| - = No Data Reported; -- = Not Applicable; NA = Not Available; W = Withheld to avoid disclosure of individual company data. |
| Release Date: 3/29/2024 |
| Next Release Date: 4/30/2024 |