|
Download Data (XLS File) |
|
||||||||
|
||||||||
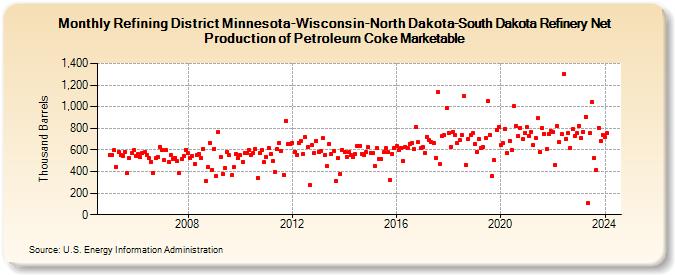
| Refining District Minnesota-Wisconsin-North Dakota-South Dakota Refinery Net Production of Petroleum Coke Marketable (Thousand Barrels) | ||||||||
| Year | Jan | Feb | Mar | Apr | May | Jun | Jul | Aug | Sep | Oct | Nov | Dec |
|---|---|---|---|---|---|---|---|---|---|---|---|---|
| 2005 | 551 | 554 | 596 | 443 | 585 | 556 | 548 | 583 | 383 | 529 | 569 | 595 |
| 2006 | 545 | 560 | 530 | 567 | 577 | 556 | 521 | 488 | 384 | 521 | 531 | 629 |
| 2007 | 603 | 504 | 596 | 490 | 552 | 515 | 528 | 493 | 390 | 516 | 544 | 603 |
| 2008 | 567 | 525 | 544 | 469 | 550 | 564 | 524 | 607 | 309 | 438 | 668 | 417 |
| 2009 | 611 | 355 | 766 | 533 | 378 | 434 | 581 | 551 | 365 | 439 | 561 | 525 |
| 2010 | 550 | 490 | 572 | 572 | 601 | 556 | 571 | 607 | 343 | 569 | 601 | 487 |
| 2011 | 538 | 619 | 560 | 493 | 396 | 606 | 664 | 591 | 372 | 871 | 652 | 654 |
| 2012 | 664 | 581 | 557 | 667 | 686 | 563 | 715 | 625 | 272 | 645 | 572 | 681 |
| 2013 | 582 | 586 | 707 | 555 | 450 | 658 | 558 | 593 | 314 | 526 | 379 | 602 |
| 2014 | 583 | 537 | 582 | 549 | 537 | 561 | 632 | 640 | 566 | 557 | 578 | 624 |
| 2015 | 575 | 573 | 449 | 614 | 517 | 518 | 576 | 614 | 578 | 317 | 566 | 622 |
| 2016 | 636 | 595 | 622 | 497 | 626 | 616 | 656 | 662 | 605 | 810 | 670 | 616 |
| 2017 | 628 | 574 | 722 | 689 | 671 | 662 | 523 | 1,133 | 465 | 727 | 734 | 988 |
| 2018 | 759 | 630 | 769 | 737 | 660 | 689 | 739 | 1,095 | 458 | 703 | 735 | 754 |
| 2019 | 651 | 577 | 699 | 613 | 625 | 712 | 1,053 | 738 | 356 | 502 | 784 | 814 |
| 2020 | 645 | 660 | 796 | 567 | 685 | 599 | 1,004 | 821 | 733 | 806 | 698 | 757 |
| 2021 | 809 | 729 | 770 | 644 | 712 | 892 | 580 | 803 | 750 | 606 | 747 | 774 |
| 2022 | 768 | 458 | 818 | 675 | 743 | 1,304 | 702 | 756 | 619 | 790 | 732 | 753 |
| 2023 | 821 | 712 | 768 | 909 | 104 | 757 | 1,043 | 525 | 412 | 807 | 682 | 740 |
| 2024 | 717 | |||||||||||
| - = No Data Reported; -- = Not Applicable; NA = Not Available; W = Withheld to avoid disclosure of individual company data. |
| Release Date: 3/29/2024 |
| Next Release Date: 4/30/2024 |