|
Download Data (XLS File) |
|
||||||||
|
||||||||
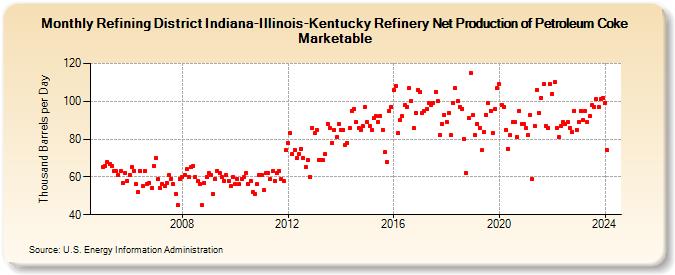
| Refining District Indiana-Illinois-Kentucky Refinery Net Production of Petroleum Coke Marketable (Thousand Barrels per Day) | ||||||||
| Year | Jan | Feb | Mar | Apr | May | Jun | Jul | Aug | Sep | Oct | Nov | Dec |
|---|---|---|---|---|---|---|---|---|---|---|---|---|
| 2005 | 65 | 66 | 68 | 67 | 66 | 63 | 63 | 61 | 63 | 57 | 62 | 58 |
| 2006 | 61 | 65 | 63 | 56 | 52 | 63 | 55 | 63 | 56 | 57 | 54 | 66 |
| 2007 | 70 | 59 | 54 | 56 | 55 | 57 | 61 | 59 | 56 | 51 | 45 | 59 |
| 2008 | 60 | 61 | 64 | 60 | 65 | 66 | 60 | 58 | 56 | 45 | 57 | 60 |
| 2009 | 62 | 61 | 51 | 59 | 63 | 62 | 60 | 58 | 61 | 58 | 55 | 60 |
| 2010 | 56 | 59 | 56 | 59 | 60 | 62 | 56 | 58 | 52 | 51 | 56 | 61 |
| 2011 | 61 | 53 | 62 | 62 | 59 | 63 | 58 | 62 | 63 | 59 | 58 | 74 |
| 2012 | 78 | 83 | 72 | 74 | 70 | 72 | 75 | 70 | 65 | 69 | 60 | 86 |
| 2013 | 83 | 85 | 69 | 69 | 69 | 72 | 88 | 86 | 78 | 85 | 81 | 88 |
| 2014 | 85 | 85 | 77 | 78 | 86 | 95 | 96 | 89 | 86 | 85 | 87 | 97 |
| 2015 | 89 | 87 | 85 | 91 | 92 | 89 | 92 | 85 | 73 | 68 | 95 | 97 |
| 2016 | 106 | 108 | 83 | 90 | 92 | 98 | 97 | 107 | 100 | 86 | 94 | 106 |
| 2017 | 105 | 94 | 95 | 96 | 99 | 98 | 99 | 105 | 100 | 82 | 88 | 93 |
| 2018 | 89 | 94 | 82 | 99 | 107 | 100 | 97 | 96 | 80 | 62 | 91 | 115 |
| 2019 | 93 | 82 | 88 | 86 | 74 | 84 | 93 | 99 | 95 | 83 | 96 | 107 |
| 2020 | 109 | 98 | 97 | 85 | 75 | 82 | 89 | 89 | 81 | 95 | 88 | 88 |
| 2021 | 86 | 82 | 93 | 59 | 87 | 106 | 94 | 102 | 109 | 87 | 86 | 109 |
| 2022 | 104 | 110 | 86 | 81 | 87 | 89 | 88 | 89 | 86 | 84 | 95 | 85 |
| 2023 | 89 | 95 | 90 | 95 | 89 | 92 | 98 | 97 | 101 | 97 | 101 | 102 |
| 2024 | 99 | 74 | ||||||||||
| - = No Data Reported; -- = Not Applicable; NA = Not Available; W = Withheld to avoid disclosure of individual company data. |
| Release Date: 4/30/2024 |
| Next Release Date: 5/31/2024 |