|
Download Data (XLS File) |
|
||||||||
|
||||||||
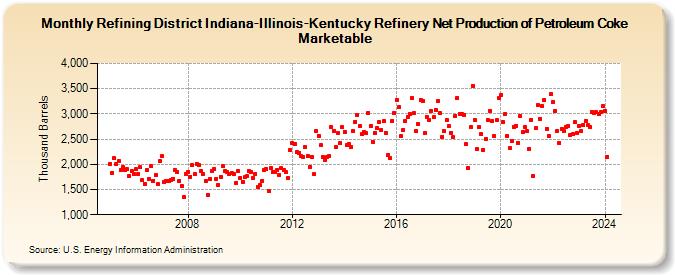
| Refining District Indiana-Illinois-Kentucky Refinery Net Production of Petroleum Coke Marketable (Thousand Barrels) | ||||||||
| Year | Jan | Feb | Mar | Apr | May | Jun | Jul | Aug | Sep | Oct | Nov | Dec |
|---|---|---|---|---|---|---|---|---|---|---|---|---|
| 2005 | 2,014 | 1,836 | 2,120 | 2,010 | 2,060 | 1,892 | 1,939 | 1,879 | 1,901 | 1,774 | 1,870 | 1,800 |
| 2006 | 1,901 | 1,810 | 1,940 | 1,684 | 1,618 | 1,884 | 1,716 | 1,964 | 1,676 | 1,779 | 1,606 | 2,057 |
| 2007 | 2,157 | 1,656 | 1,661 | 1,673 | 1,693 | 1,717 | 1,885 | 1,843 | 1,675 | 1,579 | 1,344 | 1,817 |
| 2008 | 1,856 | 1,758 | 1,983 | 1,800 | 2,005 | 1,981 | 1,858 | 1,802 | 1,670 | 1,390 | 1,715 | 1,873 |
| 2009 | 1,911 | 1,716 | 1,586 | 1,756 | 1,959 | 1,867 | 1,853 | 1,801 | 1,827 | 1,798 | 1,637 | 1,867 |
| 2010 | 1,738 | 1,656 | 1,742 | 1,761 | 1,863 | 1,852 | 1,738 | 1,812 | 1,551 | 1,587 | 1,678 | 1,895 |
| 2011 | 1,903 | 1,476 | 1,923 | 1,853 | 1,840 | 1,891 | 1,788 | 1,918 | 1,891 | 1,843 | 1,728 | 2,280 |
| 2012 | 2,419 | 2,398 | 2,238 | 2,233 | 2,159 | 2,146 | 2,336 | 2,158 | 1,956 | 2,146 | 1,799 | 2,652 |
| 2013 | 2,570 | 2,376 | 2,149 | 2,083 | 2,147 | 2,160 | 2,732 | 2,662 | 2,337 | 2,623 | 2,422 | 2,731 |
| 2014 | 2,650 | 2,375 | 2,401 | 2,348 | 2,660 | 2,841 | 2,974 | 2,761 | 2,592 | 2,649 | 2,614 | 3,018 |
| 2015 | 2,755 | 2,447 | 2,630 | 2,724 | 2,837 | 2,677 | 2,856 | 2,621 | 2,186 | 2,121 | 2,863 | 3,015 |
| 2016 | 3,282 | 3,130 | 2,561 | 2,686 | 2,857 | 2,947 | 3,001 | 3,311 | 3,009 | 2,655 | 2,805 | 3,285 |
| 2017 | 3,253 | 2,620 | 2,943 | 2,873 | 3,056 | 2,930 | 3,079 | 3,252 | 3,013 | 2,551 | 2,651 | 2,876 |
| 2018 | 2,762 | 2,629 | 2,535 | 2,966 | 3,311 | 3,003 | 2,994 | 2,987 | 2,393 | 1,926 | 2,734 | 3,563 |
| 2019 | 2,887 | 2,301 | 2,742 | 2,592 | 2,290 | 2,505 | 2,880 | 3,058 | 2,856 | 2,563 | 2,876 | 3,309 |
| 2020 | 3,378 | 2,839 | 2,996 | 2,564 | 2,314 | 2,453 | 2,747 | 2,767 | 2,429 | 2,959 | 2,640 | 2,731 |
| 2021 | 2,658 | 2,306 | 2,888 | 1,768 | 2,712 | 3,174 | 2,906 | 3,147 | 3,281 | 2,708 | 2,571 | 3,393 |
| 2022 | 3,234 | 3,066 | 2,669 | 2,419 | 2,704 | 2,658 | 2,732 | 2,762 | 2,590 | 2,596 | 2,837 | 2,621 |
| 2023 | 2,763 | 2,657 | 2,789 | 2,862 | 2,770 | 2,749 | 3,037 | 3,017 | 3,040 | 2,994 | 3,038 | 3,147 |
| 2024 | 3,063 | |||||||||||
| - = No Data Reported; -- = Not Applicable; NA = Not Available; W = Withheld to avoid disclosure of individual company data. |
| Release Date: 3/29/2024 |
| Next Release Date: 4/30/2024 |