|
Download Data (XLS File) |
|
||||||||
|
||||||||
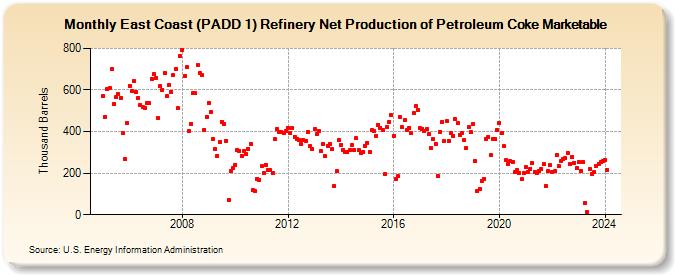
| East Coast (PADD 1) Refinery Net Production of Petroleum Coke Marketable (Thousand Barrels) | ||||||||
| Year | Jan | Feb | Mar | Apr | May | Jun | Jul | Aug | Sep | Oct | Nov | Dec |
|---|---|---|---|---|---|---|---|---|---|---|---|---|
| 2005 | 571 | 472 | 604 | 609 | 700 | 533 | 565 | 580 | 562 | 391 | 266 | 441 |
| 2006 | 621 | 595 | 643 | 590 | 562 | 529 | 519 | 513 | 536 | 537 | 655 | 676 |
| 2007 | 659 | 466 | 620 | 602 | 681 | 569 | 625 | 591 | 672 | 702 | 511 | 761 |
| 2008 | 794 | 667 | 710 | 404 | 438 | 586 | 584 | 721 | 681 | 672 | 409 | 472 |
| 2009 | 539 | 493 | 366 | 316 | 283 | 352 | 448 | 438 | 356 | 72 | 210 | 224 |
| 2010 | 241 | 313 | 308 | 284 | 306 | 291 | 318 | 341 | 118 | 113 | 172 | 169 |
| 2011 | 233 | 199 | 241 | 216 | 214 | 202 | 365 | 410 | 399 | 399 | 391 | 402 |
| 2012 | 419 | 393 | 417 | 375 | 366 | 359 | 340 | 360 | 356 | 397 | 330 | 316 |
| 2013 | 411 | 387 | 402 | 306 | 342 | 281 | 332 | 342 | 314 | 138 | 208 | 359 |
| 2014 | 337 | 312 | 302 | 301 | 310 | 336 | 312 | 367 | 311 | 295 | 302 | 332 |
| 2015 | 345 | 303 | 406 | 402 | 379 | 433 | 419 | 407 | 194 | 423 | 448 | 479 |
| 2016 | 381 | 174 | 185 | 469 | 420 | 454 | 408 | 418 | 391 | 488 | 522 | 505 |
| 2017 | 415 | 413 | 404 | 410 | 387 | 320 | 362 | 342 | 184 | 400 | 448 | 354 |
| 2018 | 449 | 355 | 393 | 380 | 459 | 441 | 384 | 391 | 357 | 321 | 420 | 396 |
| 2019 | 436 | 256 | 114 | 124 | 163 | 174 | 366 | 374 | 287 | 366 | 363 | 409 |
| 2020 | 441 | 394 | 329 | 261 | 244 | 258 | 255 | 205 | 213 | 200 | 170 | 201 |
| 2021 | 228 | 207 | 222 | 248 | 206 | 199 | 211 | 222 | 244 | 140 | 209 | 238 |
| 2022 | 207 | 208 | 288 | 234 | 256 | 268 | 271 | 299 | 246 | 278 | 251 | 224 |
| 2023 | 252 | 212 | 254 | 57 | 13 | 220 | 198 | 206 | 236 | 246 | 252 | 257 |
| 2024 | 263 | |||||||||||
| - = No Data Reported; -- = Not Applicable; NA = Not Available; W = Withheld to avoid disclosure of individual company data. |
| Release Date: 3/29/2024 |
| Next Release Date: 4/30/2024 |