|
Download Data (XLS File) |
|
||||||||
|
||||||||
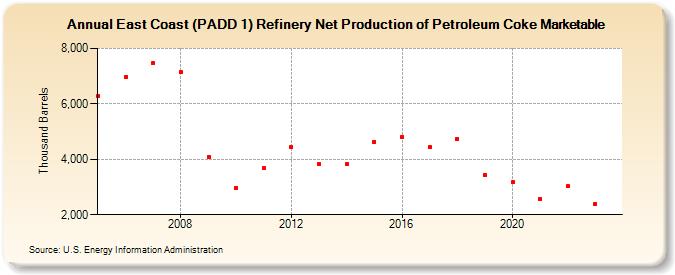
| East Coast (PADD 1) Refinery Net Production of Petroleum Coke Marketable (Thousand Barrels) | ||||||||
| Decade | Year-0 | Year-1 | Year-2 | Year-3 | Year-4 | Year-5 | Year-6 | Year-7 | Year-8 | Year-9 |
|---|---|---|---|---|---|---|---|---|---|---|
| 2000's | 6,294 | 6,976 | 7,459 | 7,138 | 4,097 | |||||
| 2010's | 2,974 | 3,671 | 4,428 | 3,822 | 3,817 | 4,638 | 4,815 | 4,439 | 4,746 | 3,432 |
| 2020's | 3,171 | 2,574 | 3,030 | 2,403 |
| - = No Data Reported; -- = Not Applicable; NA = Not Available; W = Withheld to avoid disclosure of individual company data. |
| Release Date: 3/29/2024 |
| Next Release Date: 8/30/2024 |