|
Download Data (XLS File) |
|
||||||||
|
||||||||
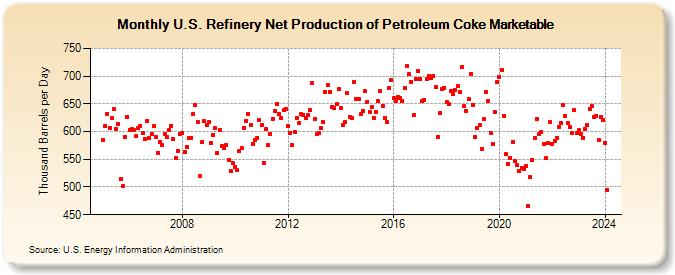
| U.S. Refinery Net Production of Petroleum Coke Marketable (Thousand Barrels per Day) | ||||||||
| Year | Jan | Feb | Mar | Apr | May | Jun | Jul | Aug | Sep | Oct | Nov | Dec |
|---|---|---|---|---|---|---|---|---|---|---|---|---|
| 2005 | 585 | 610 | 632 | 606 | 624 | 641 | 604 | 614 | 514 | 501 | 591 | 627 |
| 2006 | 603 | 605 | 602 | 592 | 606 | 610 | 598 | 587 | 619 | 588 | 596 | 610 |
| 2007 | 591 | 562 | 581 | 575 | 596 | 590 | 603 | 610 | 586 | 553 | 565 | 596 |
| 2008 | 598 | 563 | 573 | 588 | 589 | 631 | 648 | 617 | 520 | 582 | 619 | 612 |
| 2009 | 618 | 580 | 594 | 606 | 561 | 603 | 574 | 570 | 576 | 549 | 529 | 544 |
| 2010 | 536 | 530 | 565 | 571 | 607 | 619 | 632 | 611 | 578 | 584 | 589 | 620 |
| 2011 | 611 | 544 | 605 | 576 | 595 | 623 | 637 | 649 | 632 | 624 | 638 | 641 |
| 2012 | 610 | 598 | 575 | 599 | 624 | 616 | 632 | 630 | 624 | 629 | 639 | 687 |
| 2013 | 622 | 595 | 597 | 607 | 618 | 671 | 684 | 672 | 645 | 642 | 649 | 676 |
| 2014 | 642 | 612 | 617 | 669 | 626 | 624 | 690 | 659 | 658 | 631 | 637 | 673 |
| 2015 | 654 | 636 | 644 | 625 | 635 | 656 | 673 | 646 | 624 | 618 | 679 | 693 |
| 2016 | 660 | 656 | 662 | 661 | 655 | 678 | 718 | 703 | 690 | 629 | 694 | 709 |
| 2017 | 695 | 656 | 657 | 695 | 700 | 697 | 701 | 680 | 591 | 633 | 676 | 679 |
| 2018 | 653 | 650 | 674 | 667 | 675 | 682 | 671 | 716 | 646 | 637 | 658 | 704 |
| 2019 | 648 | 590 | 606 | 612 | 569 | 622 | 671 | 656 | 598 | 578 | 635 | 689 |
| 2020 | 699 | 711 | 628 | 559 | 542 | 552 | 582 | 546 | 539 | 528 | 535 | 532 |
| 2021 | 537 | 465 | 518 | 549 | 589 | 623 | 595 | 600 | 578 | 552 | 579 | 617 |
| 2022 | 577 | 583 | 589 | 609 | 616 | 648 | 628 | 616 | 608 | 597 | 638 | 597 |
| 2023 | 602 | 596 | 589 | 605 | 612 | 641 | 646 | 627 | 628 | 584 | 627 | 620 |
| 2024 | 580 | 494 | ||||||||||
| - = No Data Reported; -- = Not Applicable; NA = Not Available; W = Withheld to avoid disclosure of individual company data. |
| Release Date: 4/30/2024 |
| Next Release Date: 5/31/2024 |